
Custom code
The script block runs an R script as a workflow step. The script reads the upstream data as data, and what its last line returns flows downstream. Use it when no block does the transformation you need.
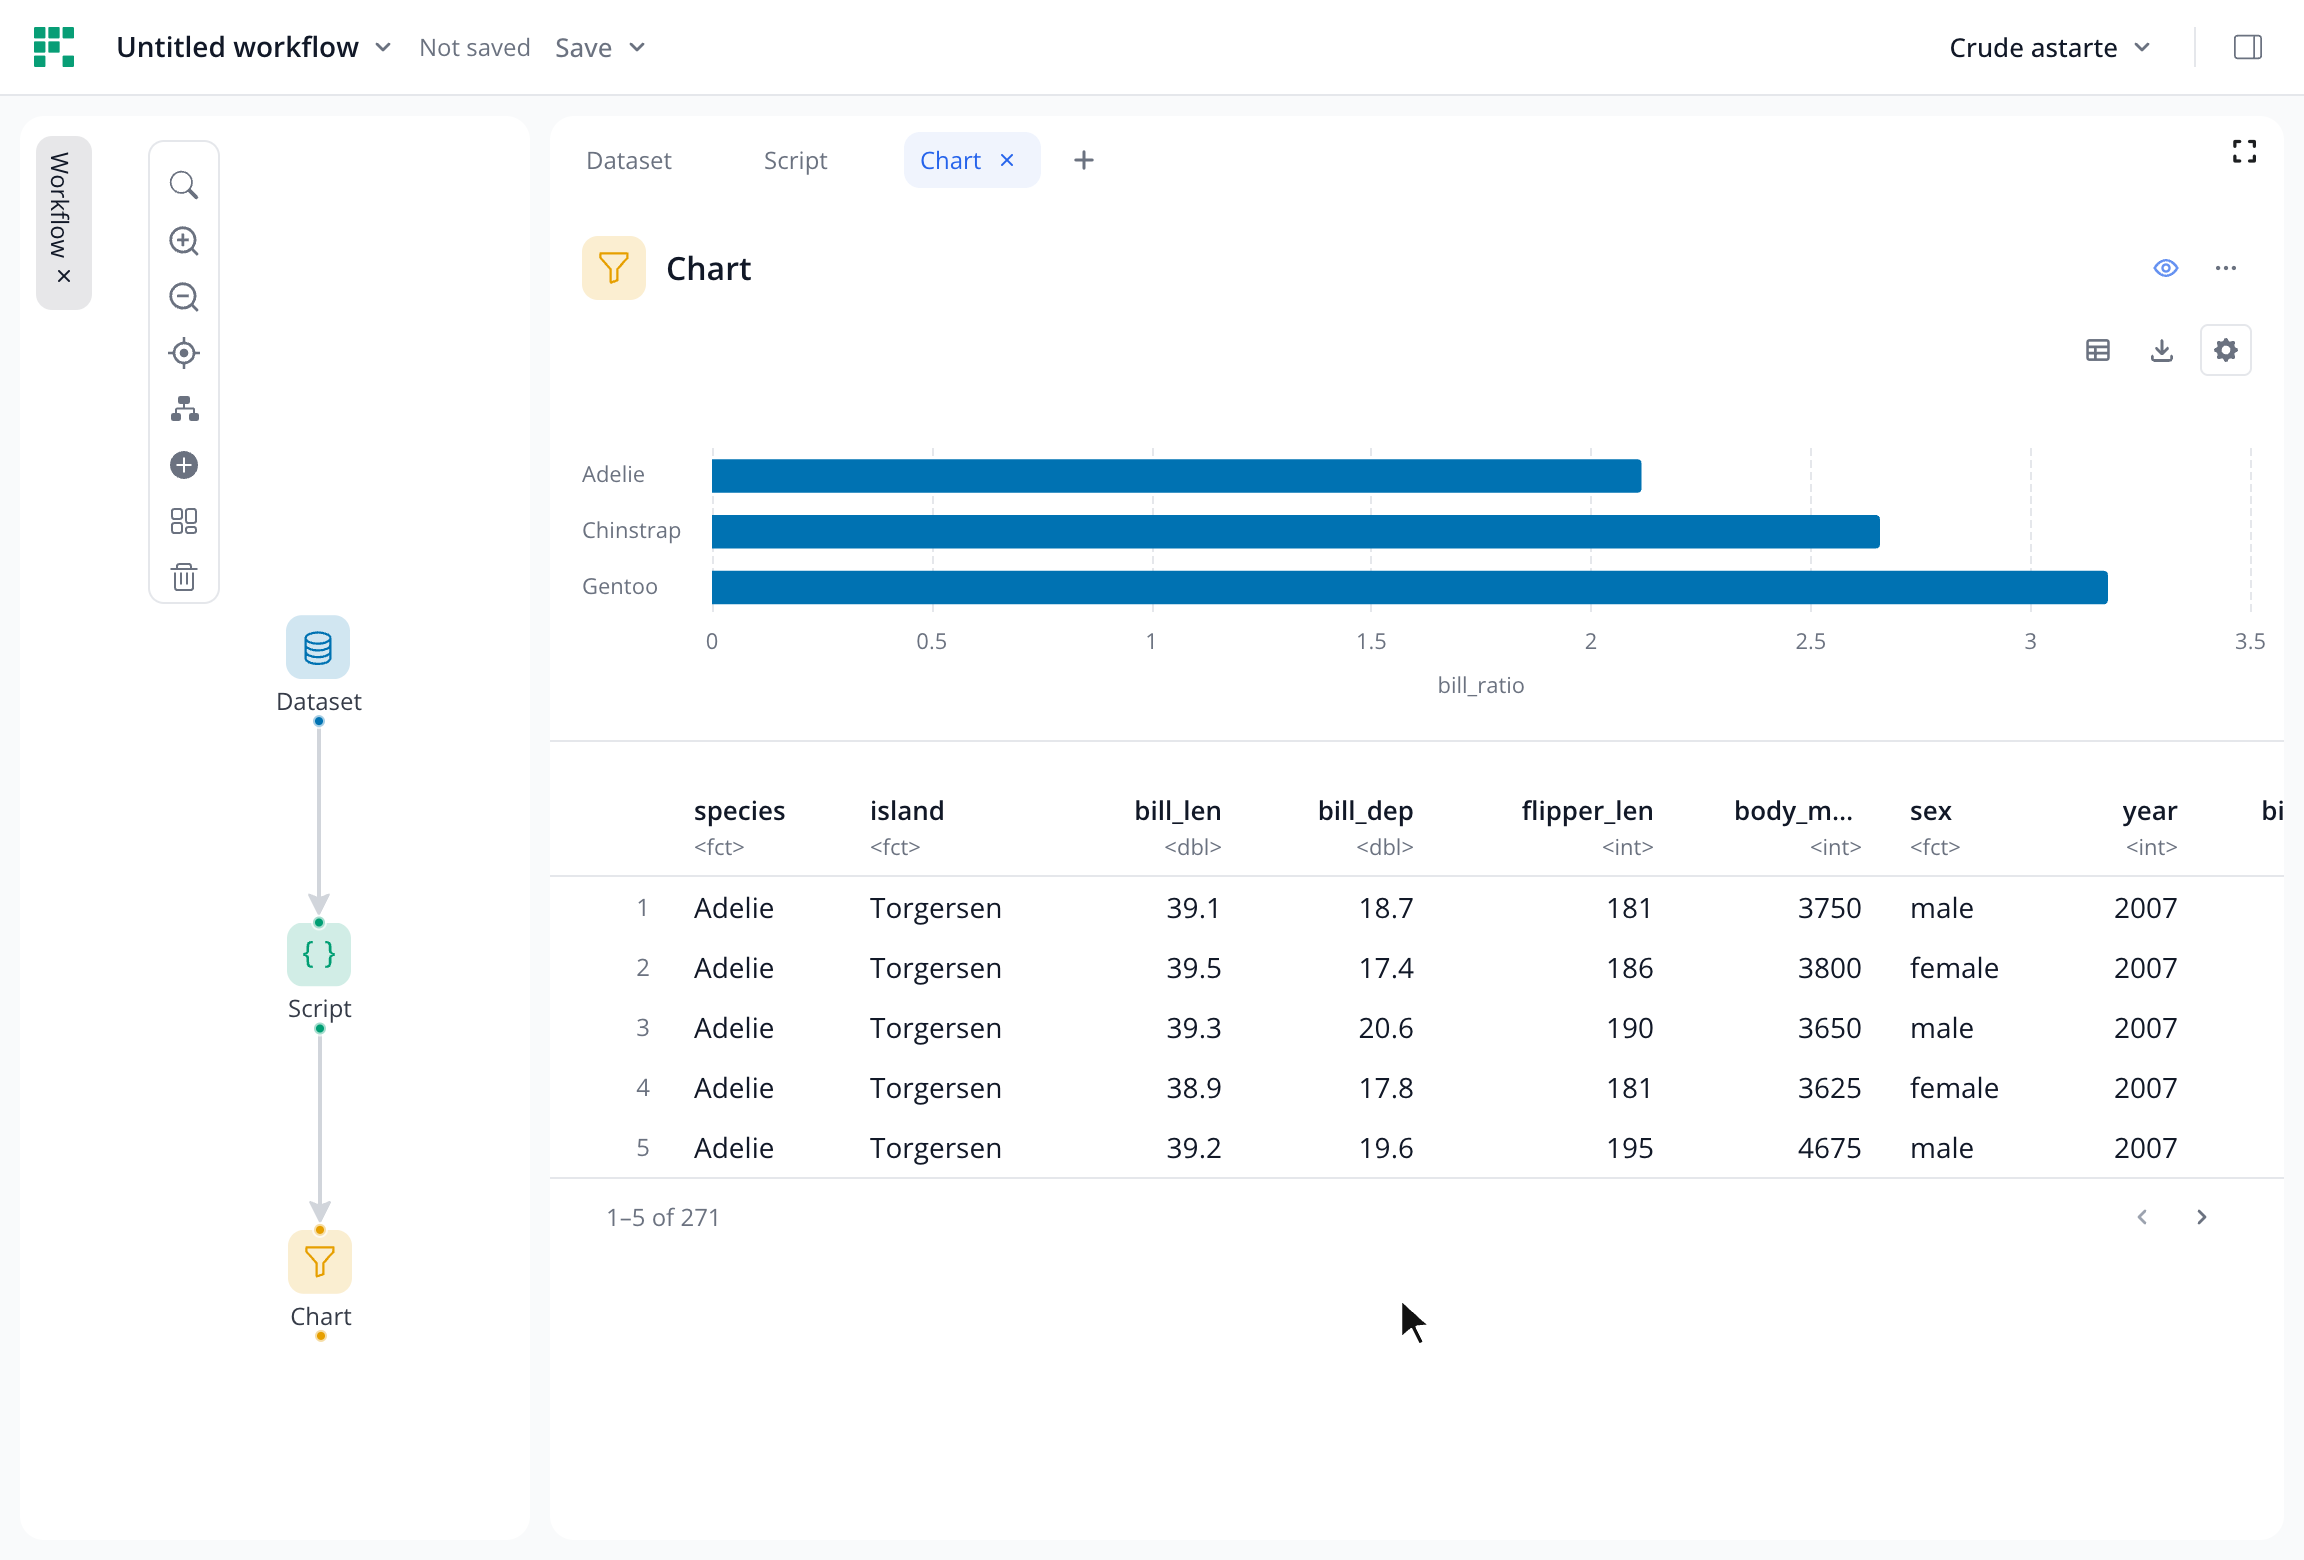
Watch the flow, then follow the steps below:
Do it yourself
Add a "Script" block after a dataset block with "penguins". Its default script keeps the first six rows:
n <- 6, thenutils::head(data, n). Thenshows up on the block as a number box.Click the gear in the script block's corner. The editor opens with the script. Replace it with:
rmin_mass <- 3500 data |> subset(body_mass >= min_mass) |> transform(bill_ratio = bill_len / bill_dep)Click "Run" (or Cmd/Ctrl+Enter). The preview keeps the 271 penguins of 3500 g or more and gains a "bill_ratio" column.
min_mass <- 3500becomes a "Min mass" box on the block: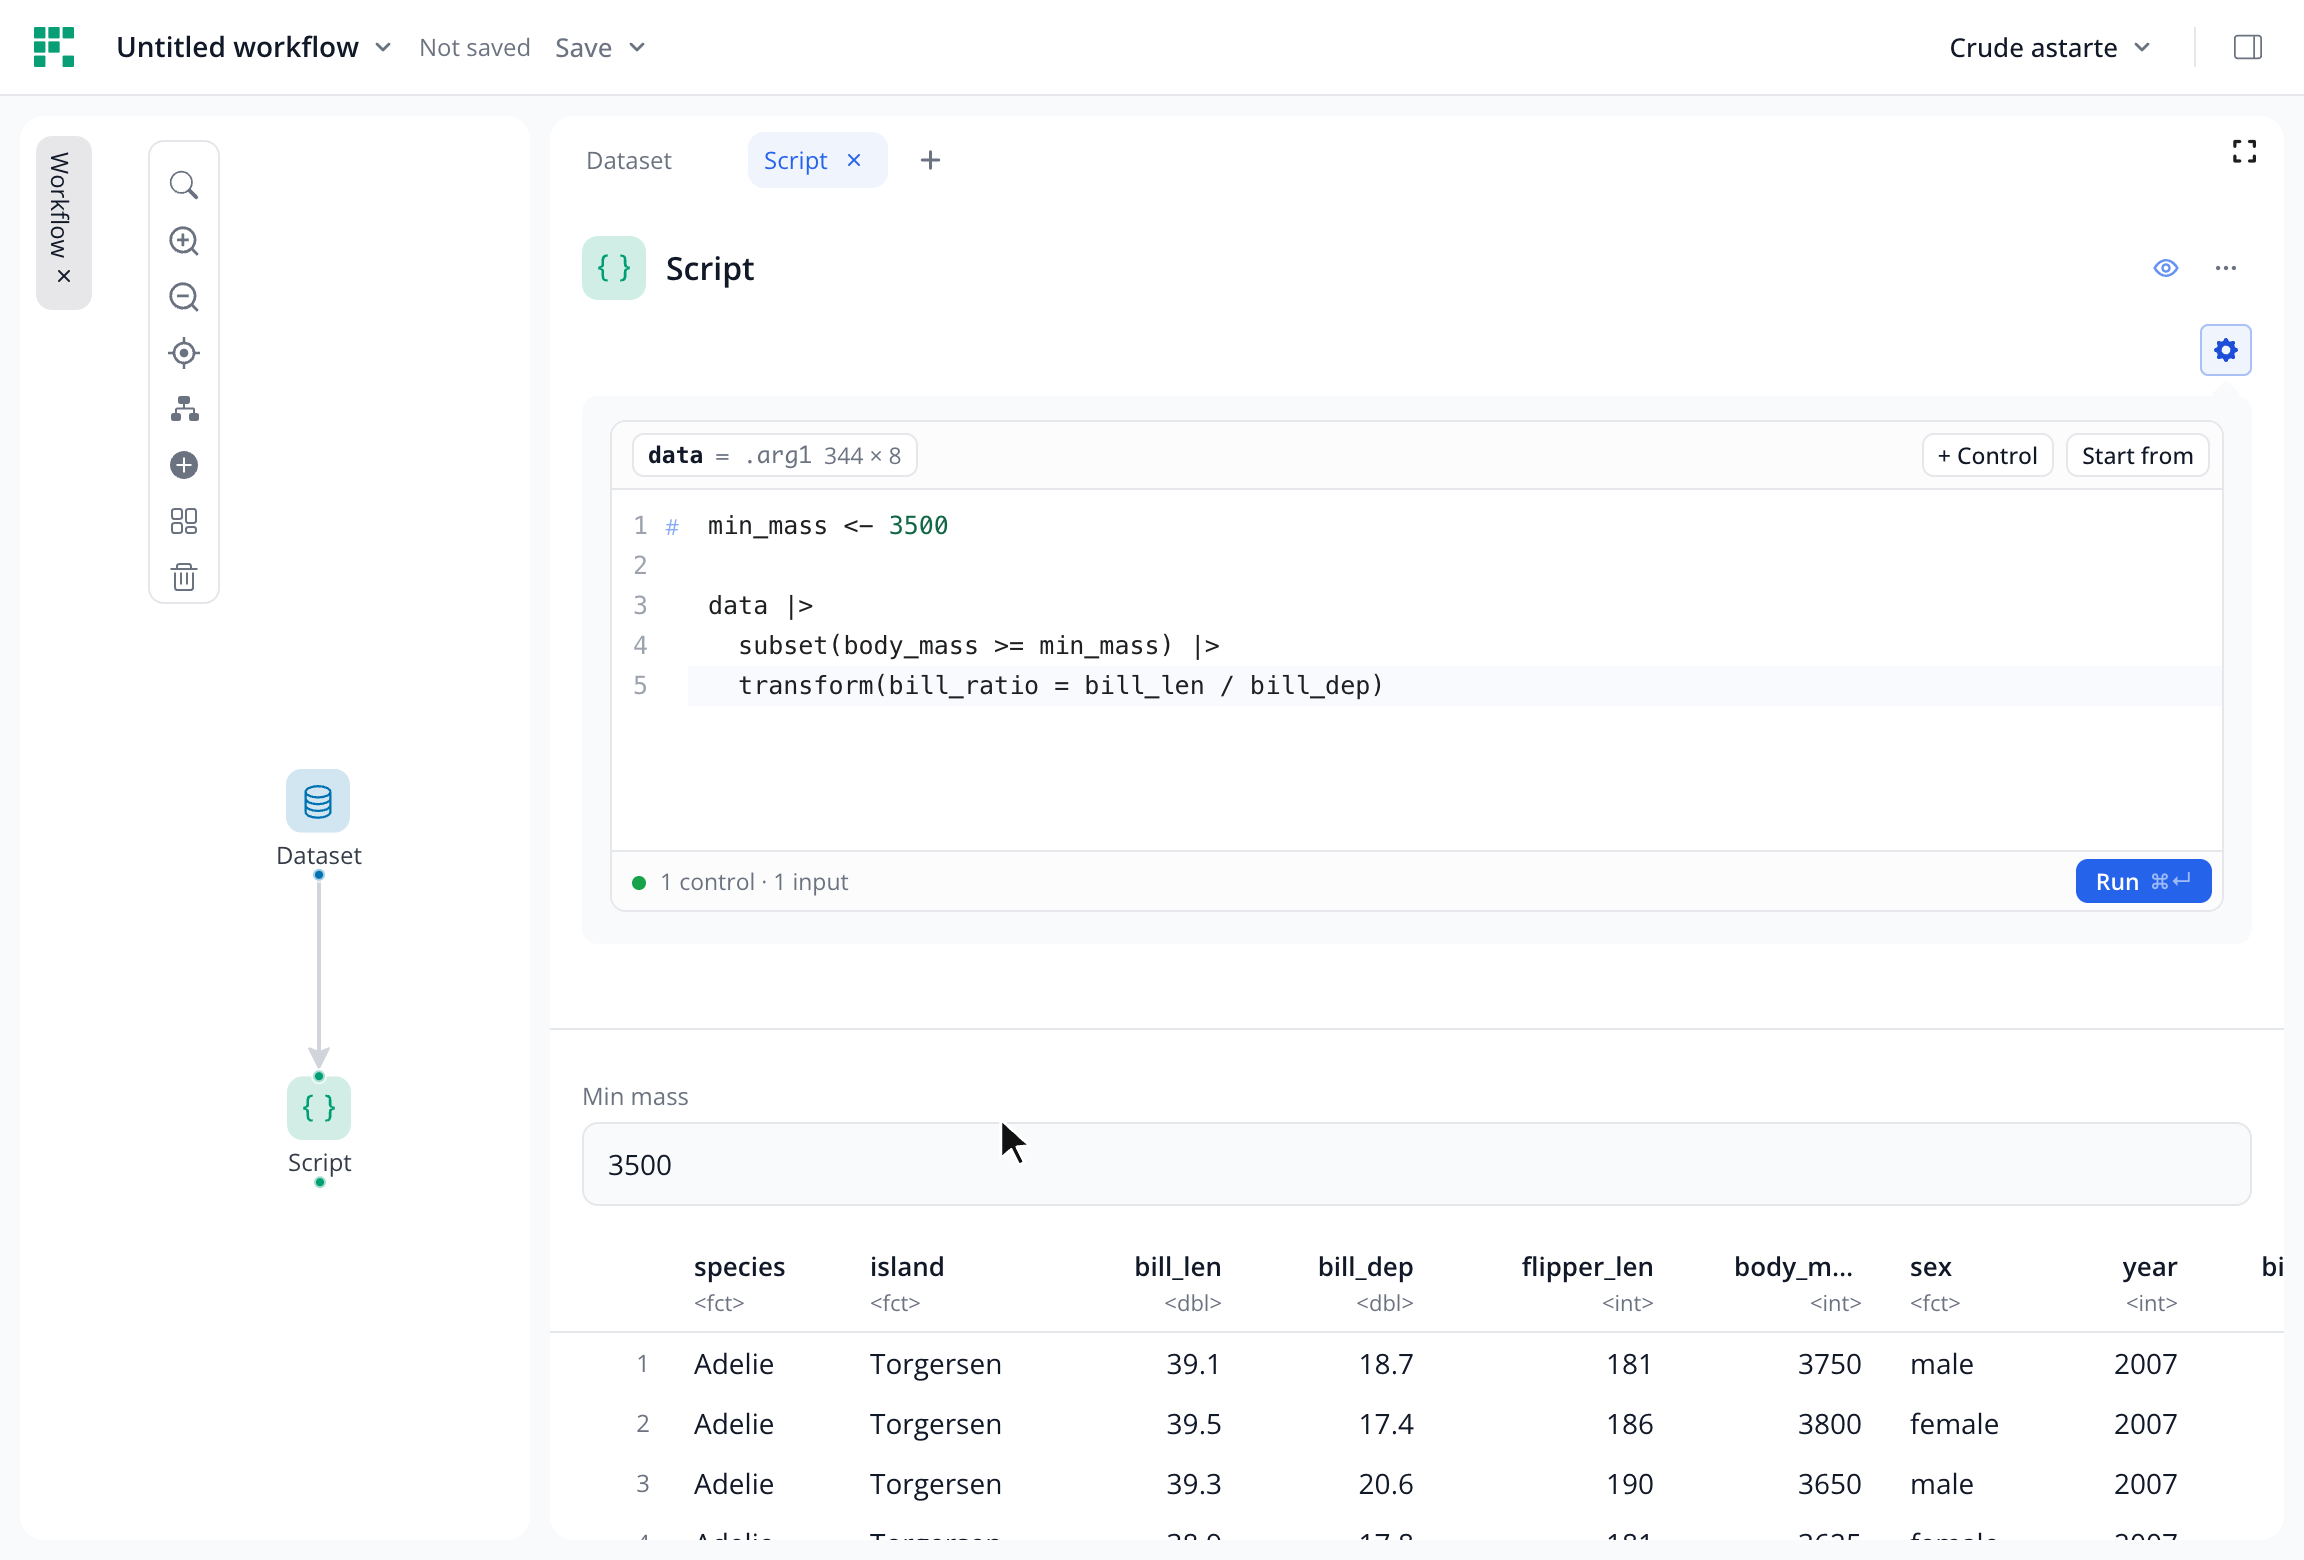
Close the gear and add a "Chart" block after the script block. In the chart's settings (its gear), set Category to "species", Aggregate to "Mean" and Value to "bill_ratio".
Back on the script block, change "Min mass" to 4500. The chart follows.
A top-level assignment of a plain value (a number, a string, TRUE/FALSE, a factor) becomes a control on the block. Whoever builds the board writes the script behind the gear; whoever uses it only sees the controls and the result.
If the assistant is turned on (Install), it can write the script from a description; you review and run it.
If the same script recurs across boards, make it a block of its own: Create a custom block.