
Examples
Curated demo workflows running on blockr.cloud. Open any example to explore it interactively.
Getting Started
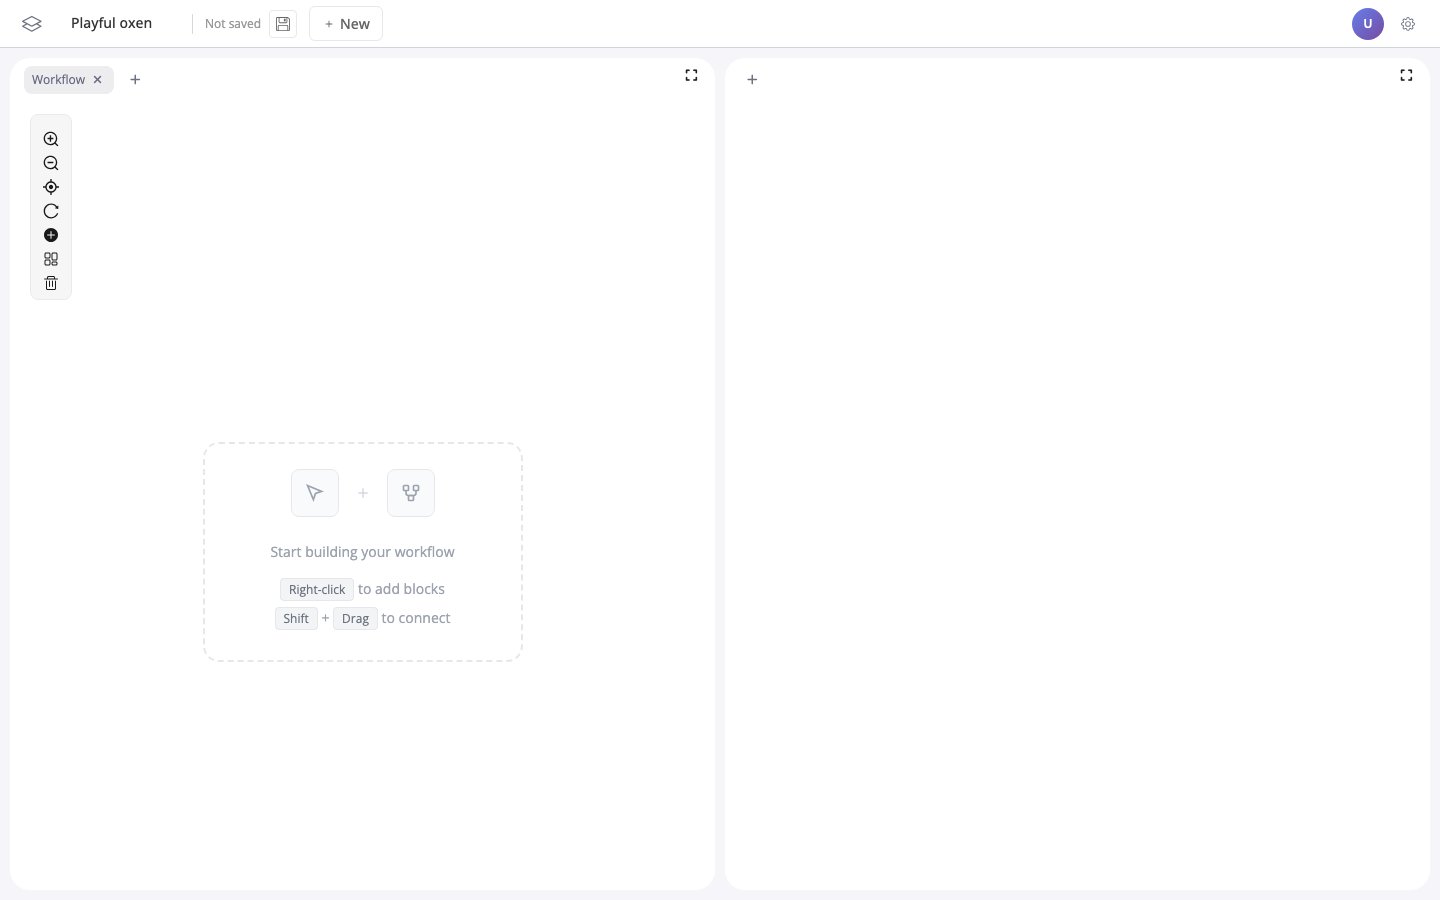
Empty Workflow
Start from a clean canvas. Add blocks, connect them, and build your own pipeline from scratch.
Open in Playground →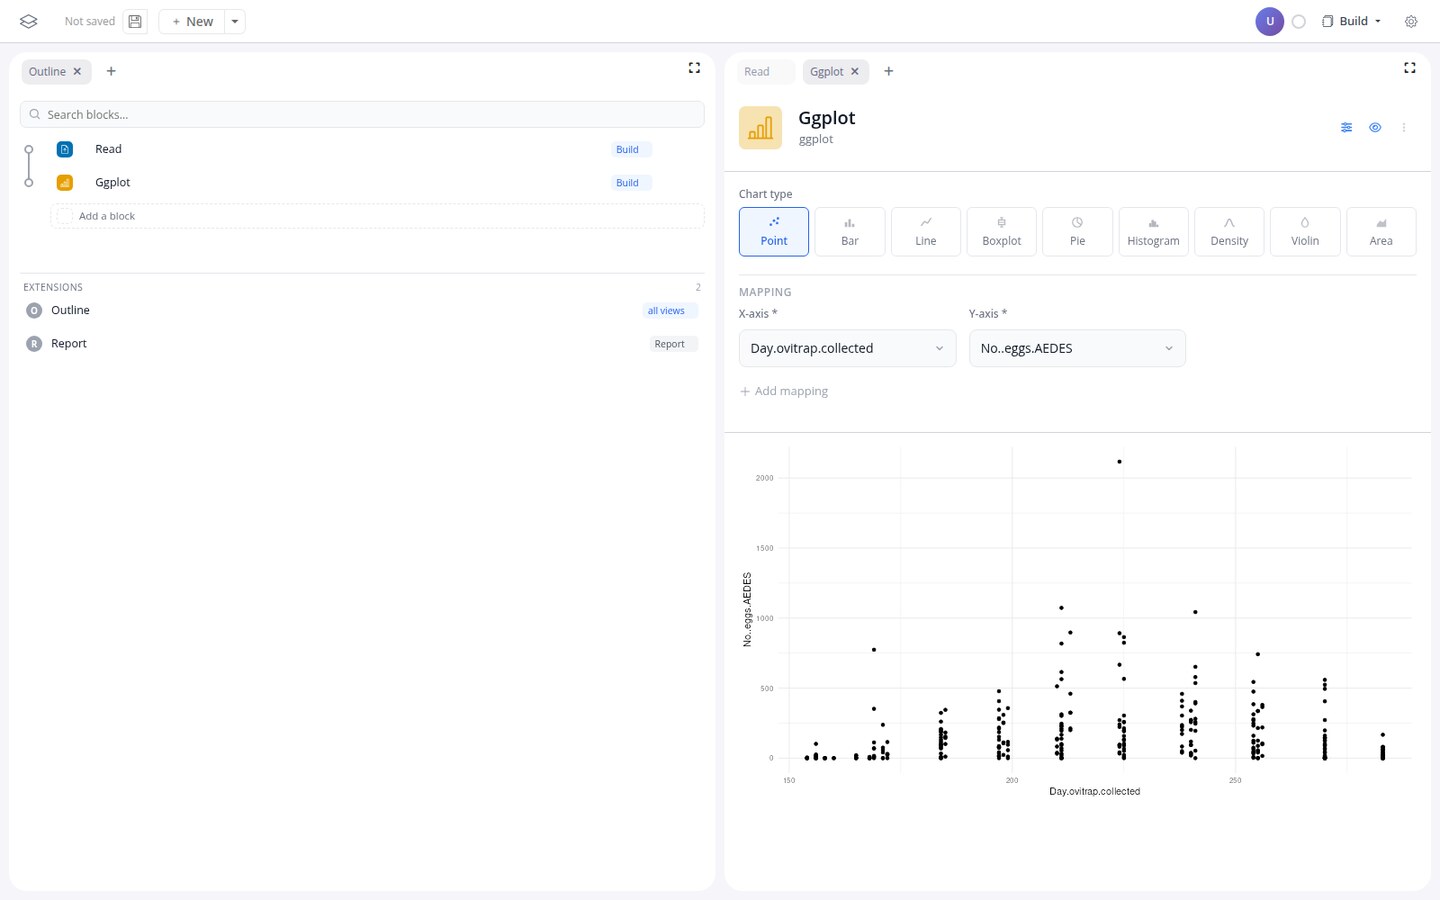
Your First Workflow
The sixty-second board. Start blank, add a dataset, filter it, plot it, and watch the outline on the left fill in as you go. Then open the Report view and read the Quarto document the three blocks wrote: about ten lines of ordinary R that runs without blockr.
Open in Playground →Pharma
Clinical Explorer
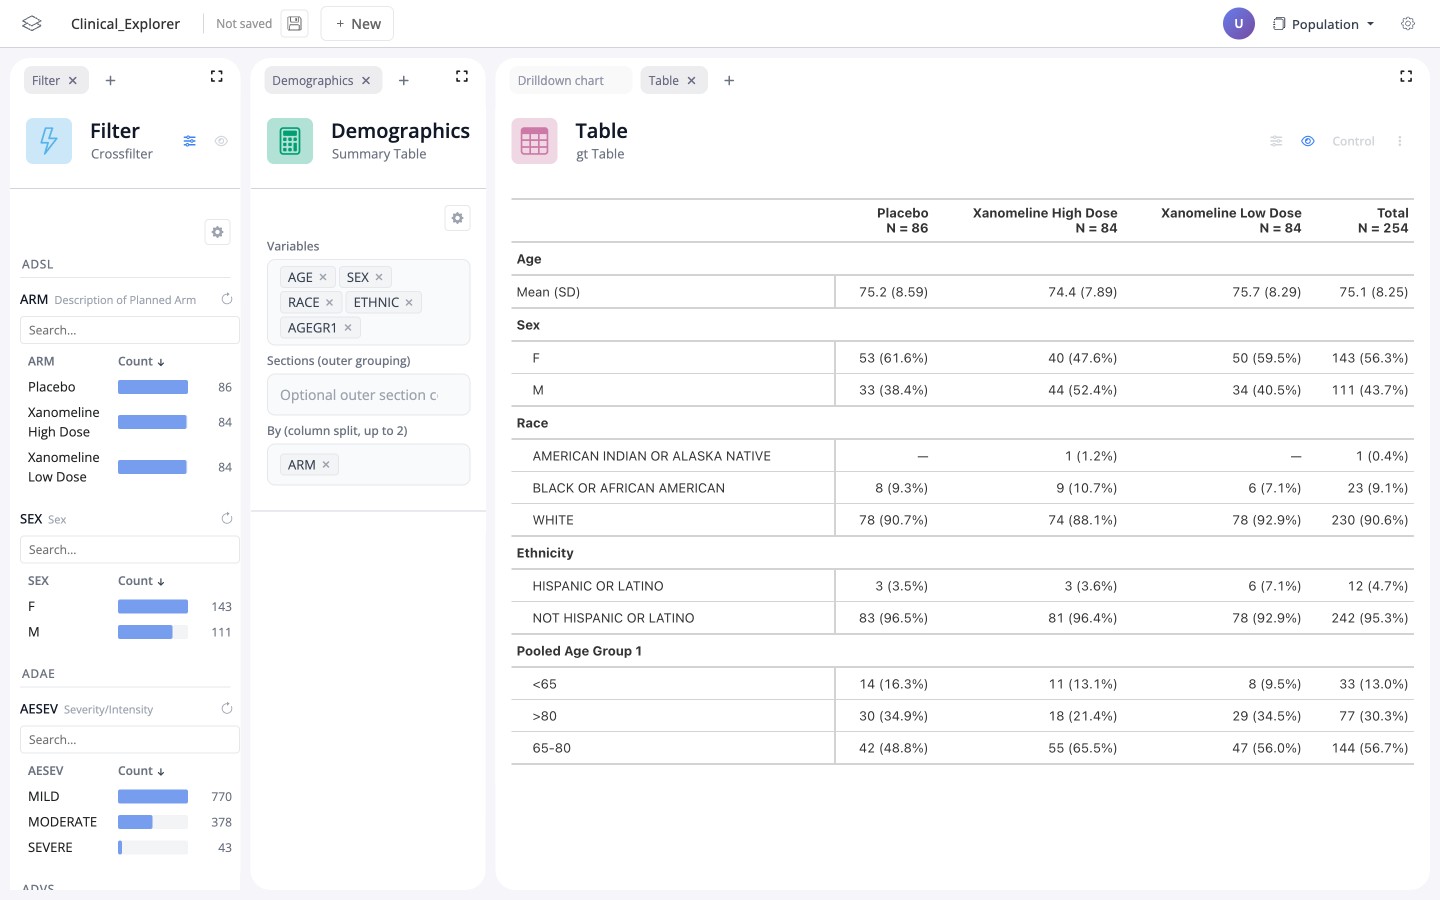
AI-enabled exploration of an ADaM trial. One cross-filter drives five views: population and disposition, an adverse-event heatmap with a frequency chart and a swim-lane, and lab and vital-sign trajectories. The patient profile, the outline and the assistant ride a rail beside them.
Open in Playground →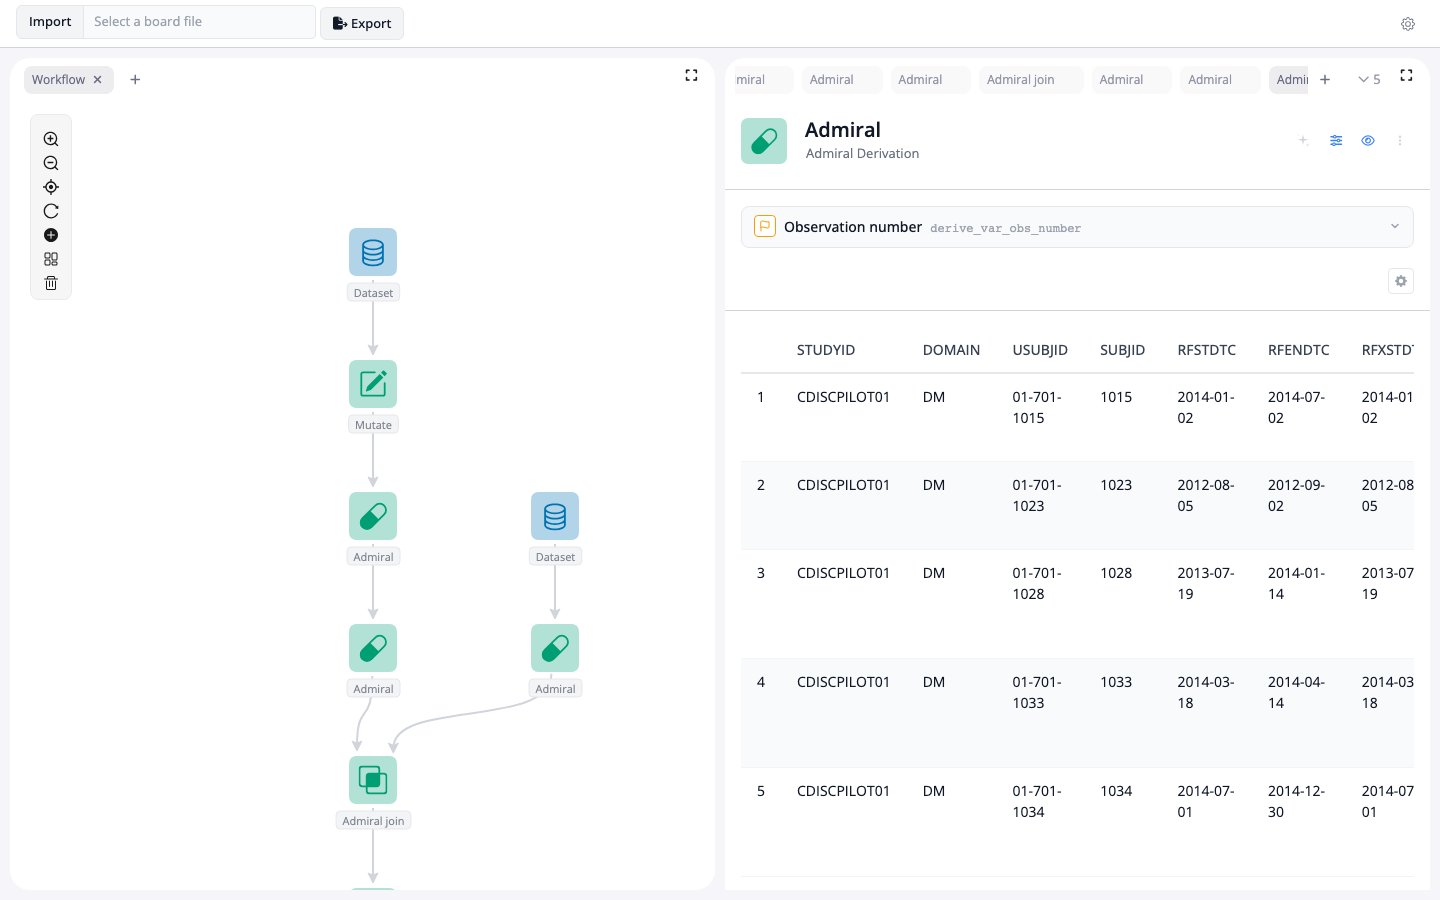
Admiral SDTM → ADSL
SDTM DM to ADSL derivation pipeline using admiral blocks: each block is one derivation step with visible intermediate results.
Open in Playground →Insurance
Life UWR Workbench
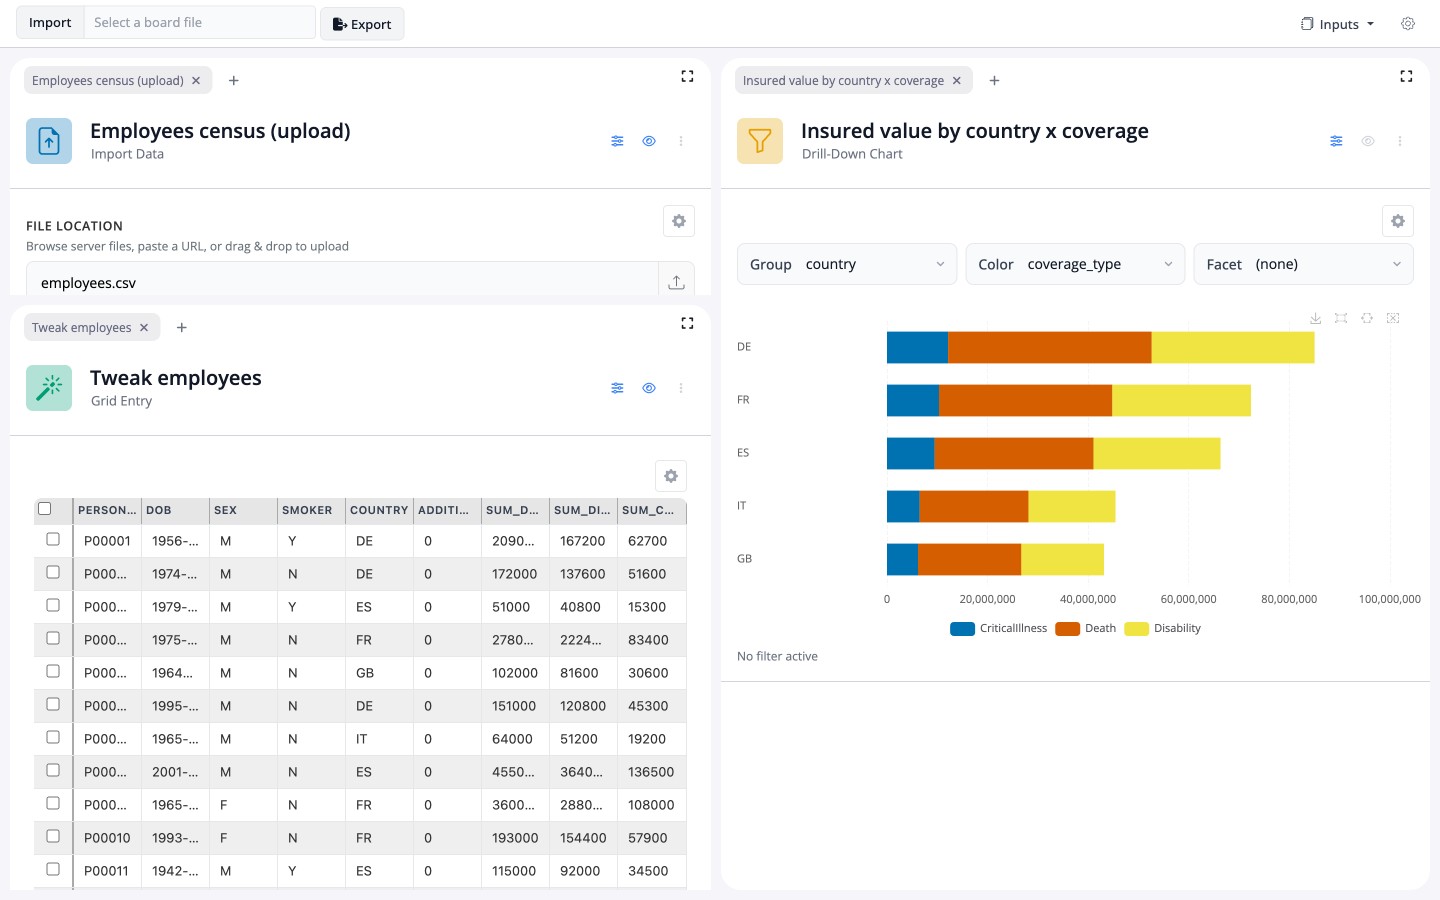
Life-insurance underwriting workbench: a per-coverage expected-claims pipeline plus a UWR price-driver dashboard over a census, claims history, and bundled actuarial tables.
Open in Playground →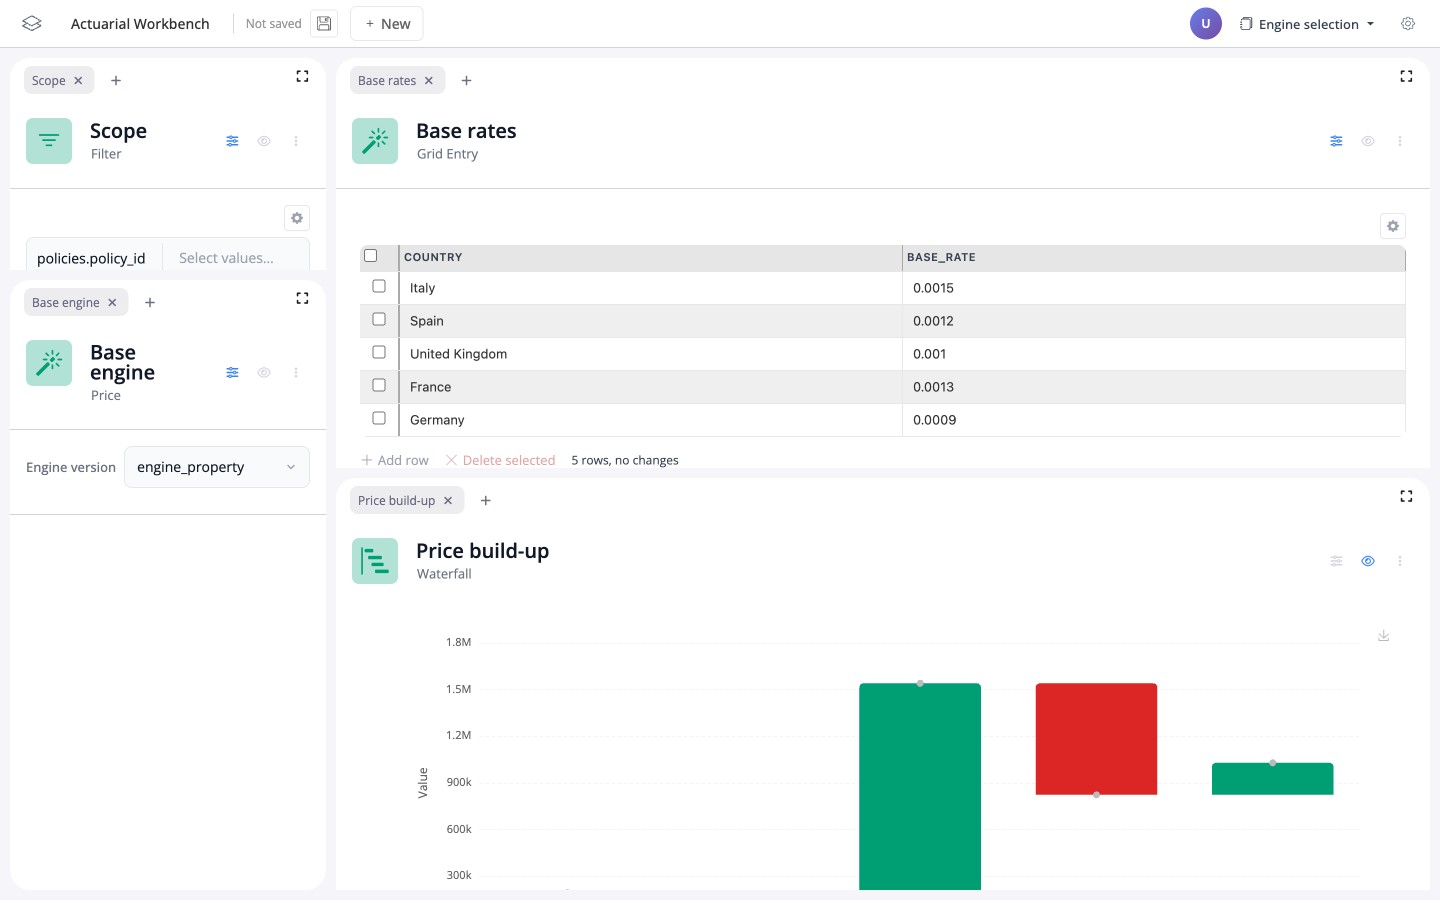
Actuarial Workbench
Property-insurance actuarial workbench: Base vs Challenger portfolio simulations with editable base-rate grids, premium components, and a run-vs-run compare waterfall.
Open in Playground →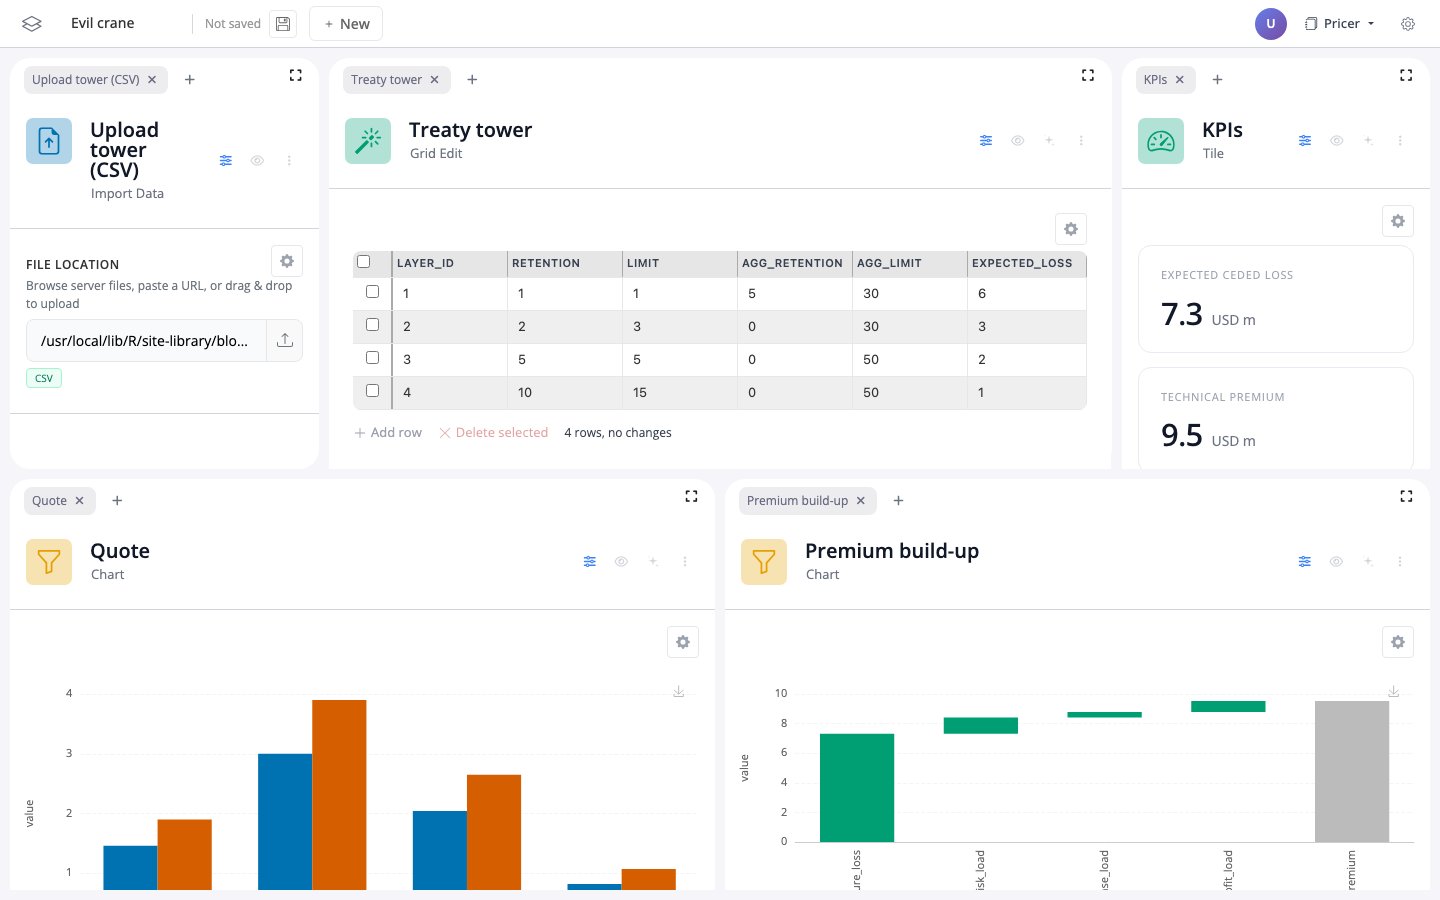
Treaty Pricer
Layered excess-of-loss treaty pricer: an editable treaty tower drives a piecewise-Pareto severity fit, loss simulation, and a per-layer premium build-up. Edit a layer and the KPIs, quote chart, and build-up waterfall all recompute.
Open in Playground →Finance
Portfolio Advisor
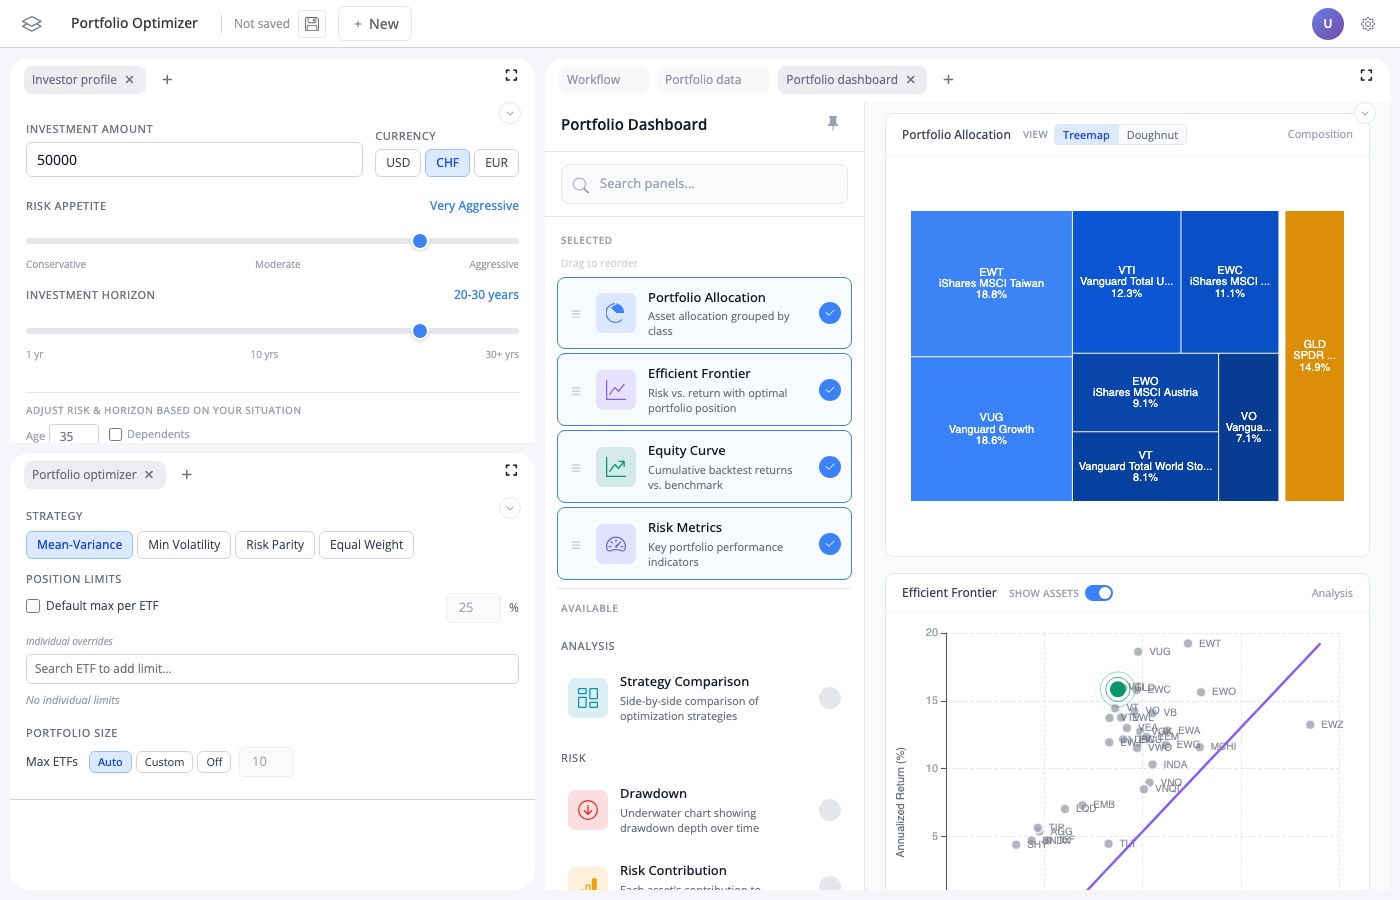
A portfolio advisor: pick an investor risk profile and an optimizer strategy on the left, and a diversified allocation dashboard recomputes on the right. A second Workflow tab shows the live block graph.
Open in Playground →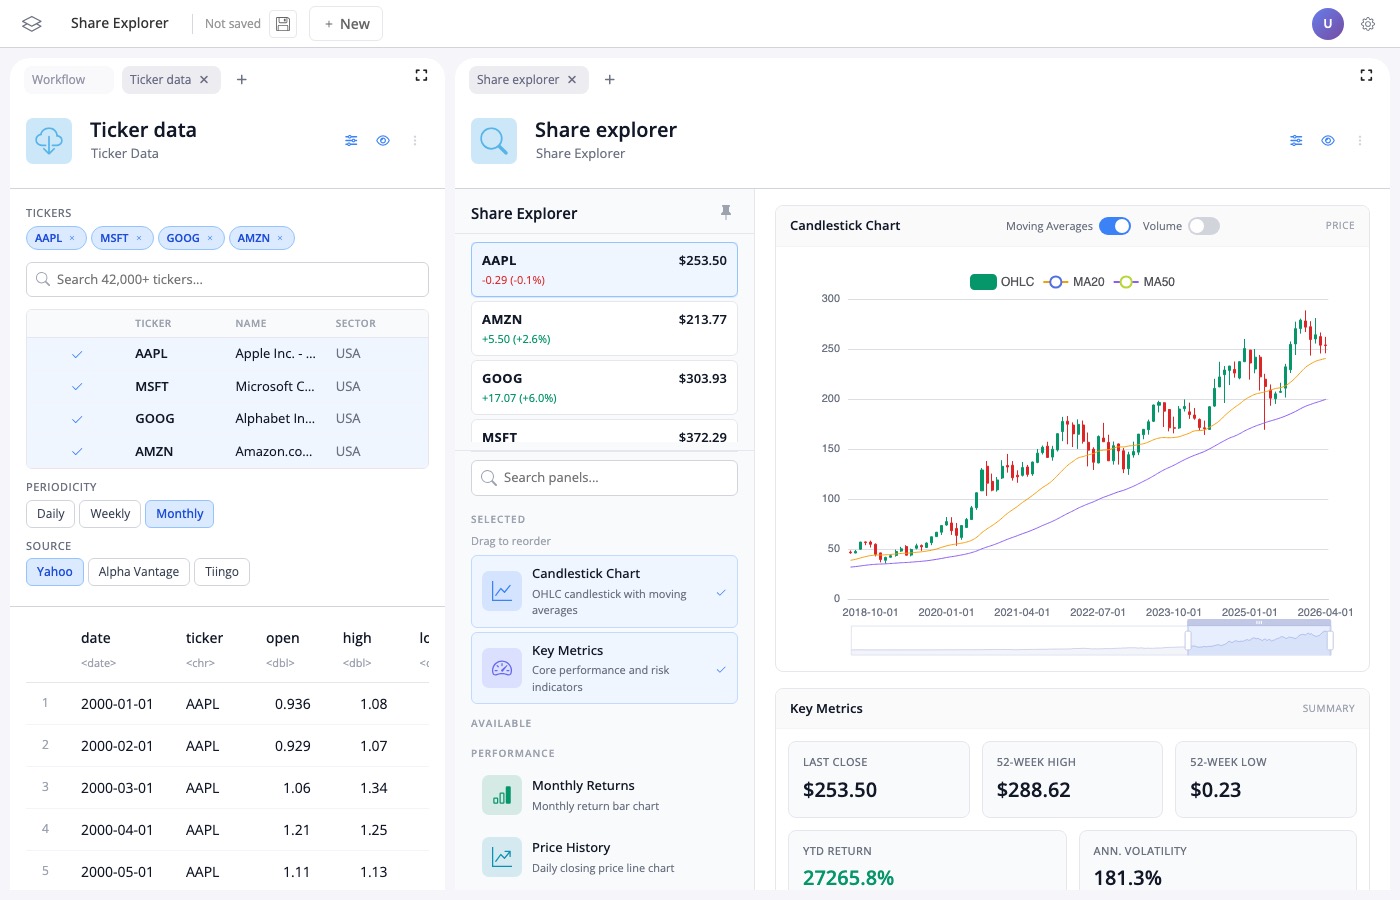
Share Explorer
An interactive share explorer: choose tickers and a date range on the left and the price / return charts recompute on the right. A second Workflow tab shows the live block graph.
Open in Playground →Statistics
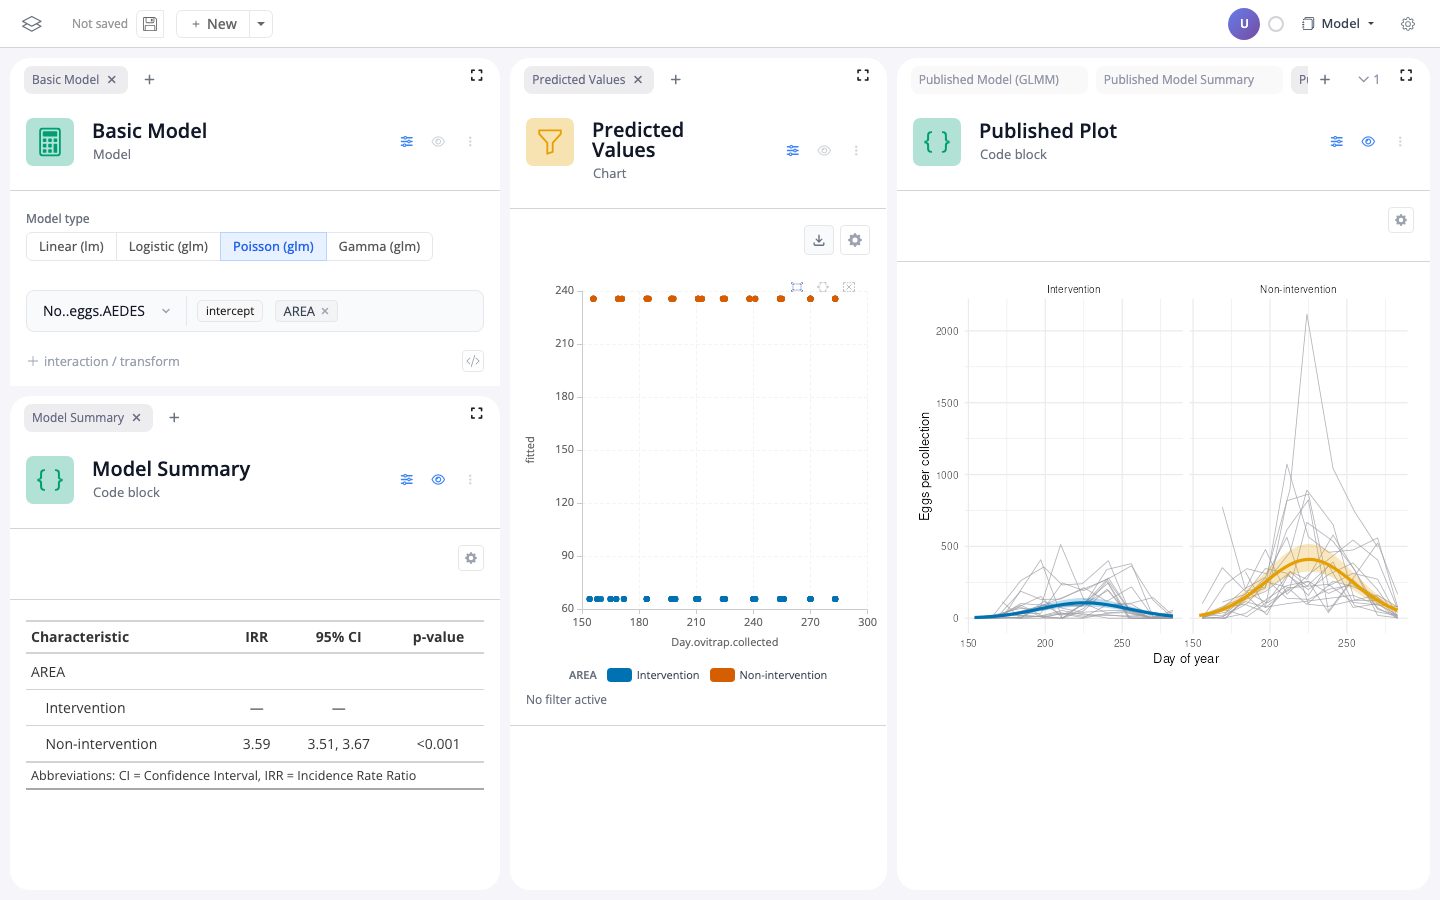
Does mosquito control work?
Refits a published mosquito-control study. The Poisson glm is built in the board by dragging a term in. The paper's negative binomial mixed model is written as plain R. Both reproduce the numbers in the paper. Joint work with Matteo Tanadini, a co-author of the study.
Open in Playground →Is the economy growing, or is it just the season?
Swiss quarterly GDP is published twice: as it happened, and seasonally adjusted. This board makes the second one. It runs X-13ARIMA-SEATS on SECO's unadjusted series with no settings and puts the result beside SECO's own published adjustment: over 186 quarters they agree to a median of 0.12 percent. Data from dataseries.org.
Open in Playground →Showcase
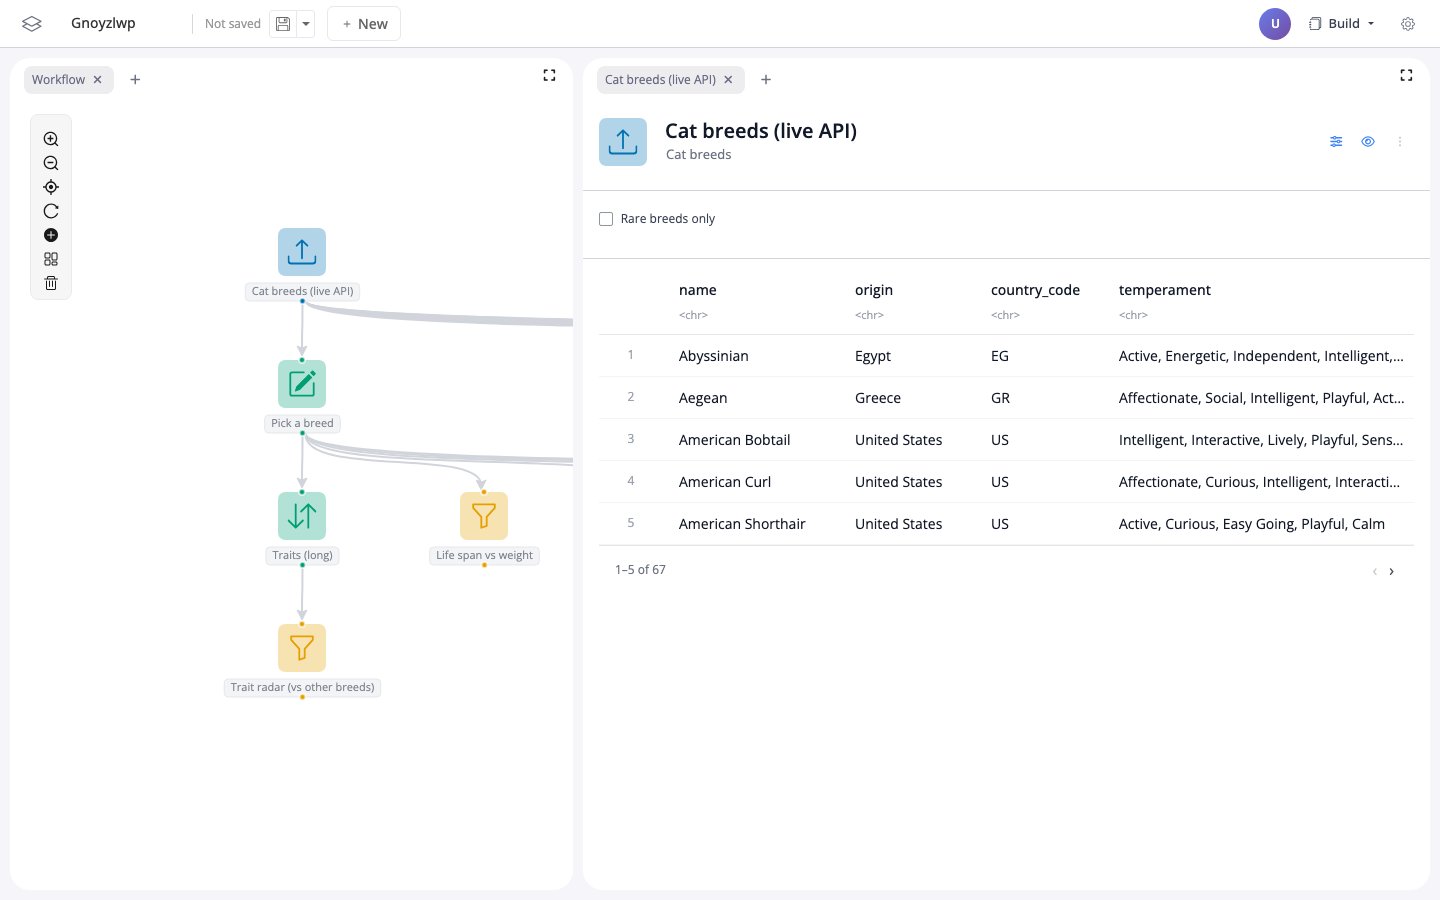
Cat Breeds
A full cat-breeds analysis end to end: trait radar, headline KPIs, correlations, a temperament word cloud and a chart-filter to drilldown pair, with AI wired both per-block and board-level (the useR! 2026 demo).
Open in Playground →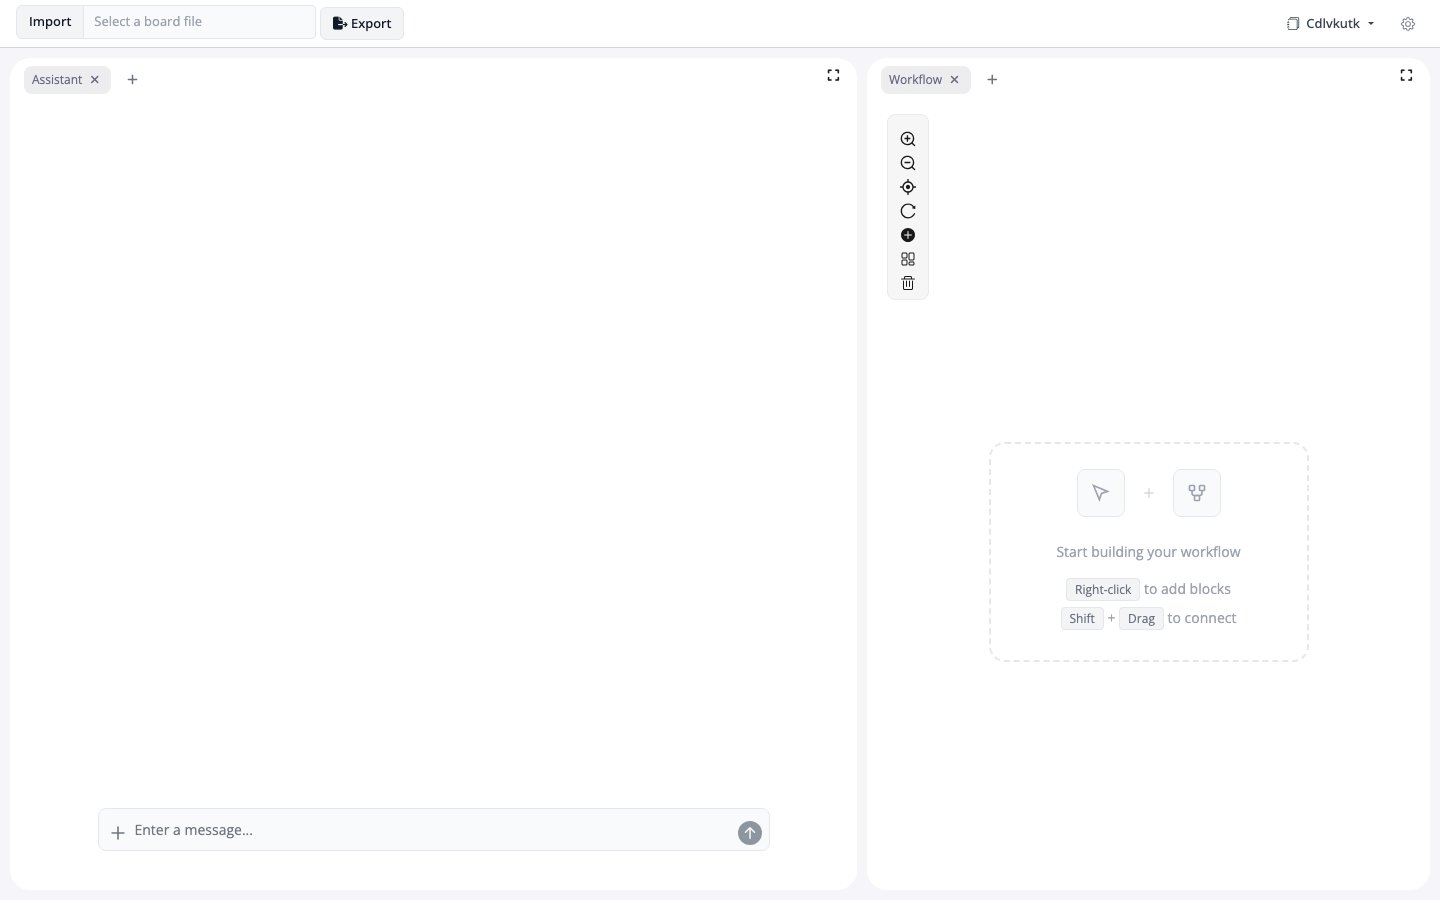
Full-Stack Assistant
An empty blockr board with the board-level LLM assistant activated: nothing is on the canvas. You build the entire workflow by talking to the assistant, which can add any block from the full blockr stack. The assistant sits on the left, the Workflow (DAG) panel on the right.
Open in Playground →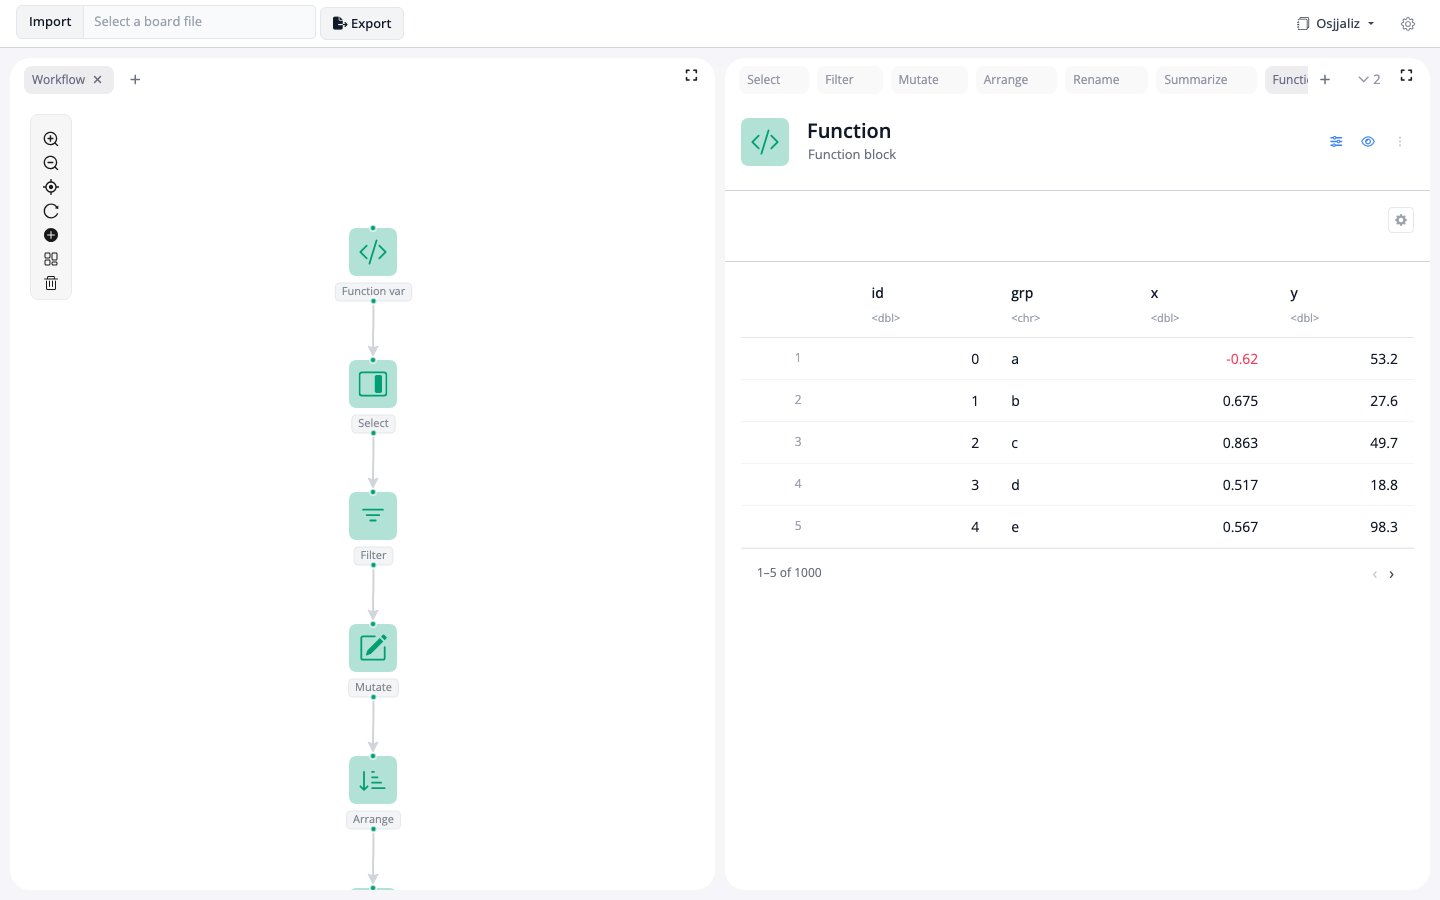
DuckDB Lazy (100M rows)
A 100,000,000-row parquet opened as a lazy DuckDB table and transformed through a chain of blockr.dplyr blocks. Every verb pushes to SQL and the preview pages through 100M rows without ever materializing the full table; only the filtered ~1000-row result is collected into R.
Open in Playground →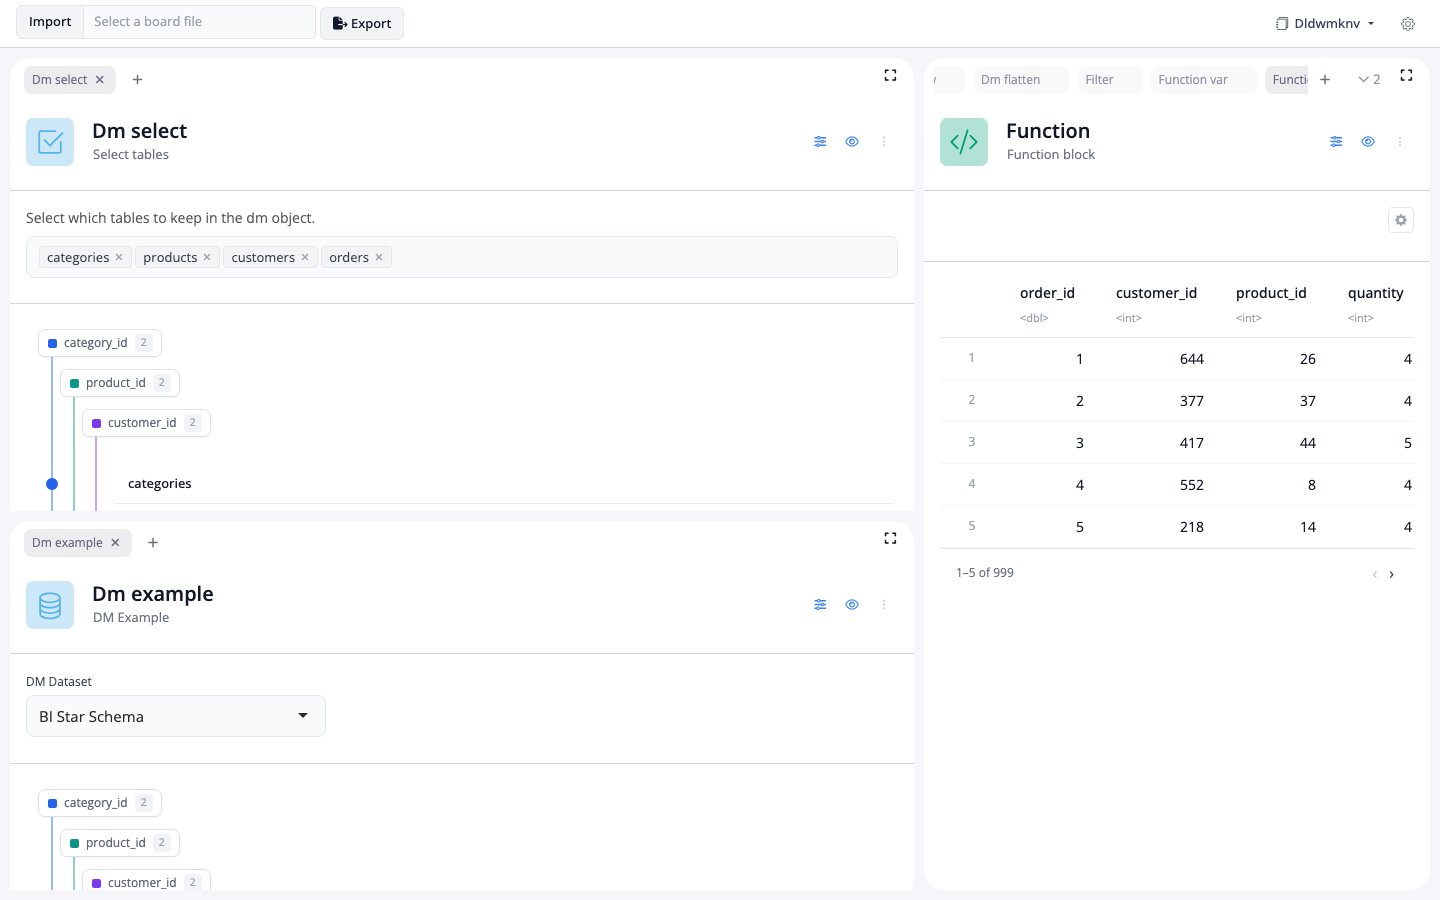
DuckDB Remote dm (5M-row star schema)
A 5,000,000-row DuckDB star schema (one fact table, three dimensions) bound into a dm and explored with the Key-lines preview - the fact table pages in the database and is never collected. A second in-memory example dm renders through the same preview.
Open in Playground →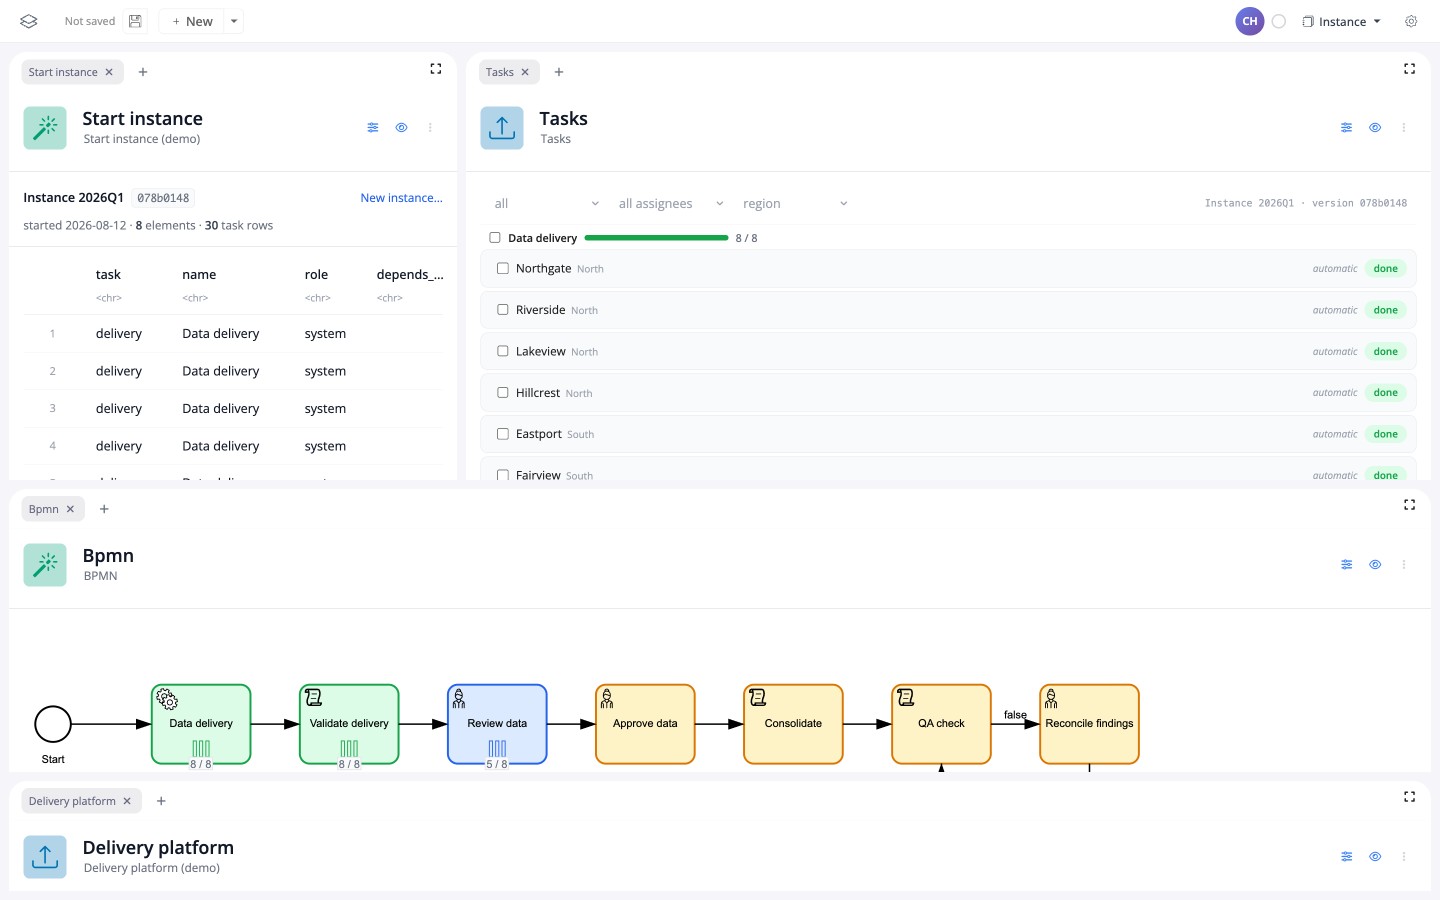
Data Collection Process
A quarterly data collection from eight reporting units, run as a process rather than a dashboard. The definition is one wide table; the state is an append-only event log; a headless worker runs the tasks that are scripts. The three front tasks repeat per unit inside a BPMN multi-instance sub-process, the QA check answers true/false on stdout so the branch and its rework loop live in the table, and "Simulate delivery" writes an inbox message the way an upload platform would - the worker turns it into an event.
Open in Playground →Run an example locally
The demos above run on blockr.cloud. To run one in your own R session, follow the setup below.
Your First Workflow
The sixty-second board. Start blank, add a dataset, filter it, plot it, and watch the outline on the left fill in as you go. Then open the Report view and read the Quarto document the three blocks wrote: about ten lines of ordinary R that runs without blockr.
First install blockr as described on the Install page. Then add the extra packages:
pak::pak("cynkra/blockr.outline")    # the outline rail and the report builder
install.packages("palmerpenguins")   # the install line on the website. `library(palmerpenguins)` here would put
Launch the demo:
source(system.file("examples/first-workflow.R", package = "blockr.outline"))Nothing is preloaded and no data package is needed. Start either way: the dataset block reads from datasets, so iris and mtcars are one picker away, or paste a csv URL into Import Data and work on your own. Connect two blocks by dragging between the dots on the outline's left rail. Open inst/examples/first-workflow.R on GitHub to see exactly what the script does.
Clinical Explorer
AI-enabled exploration of an ADaM trial. One cross-filter drives five views: population and disposition, an adverse-event heatmap with a frequency chart and a swim-lane, and lab and vital-sign trajectories. The patient profile, the outline and the assistant ride a rail beside them.
First install blockr as described on the Install page. Then add the extra packages:
pak::pak("BristolMyersSquibb/blockr.pharma")   # patient profile, AE heatmap, the study roles option
pak::pak("cynkra/blockr.outline")              # the outline rail
install.packages("safetyData")
Launch the demo:
source(system.file("examples/clinical-explorer.R", package = "blockr.pharma"))This loads the ADaM tables from safetyData and the same blocks as the live demo: the cross-filter, the AE heatmap and swim-lane, the summary tables, the lab and vital-sign trajectories, and the patient profile. Open inst/examples/clinical-explorer.R on GitHub to see exactly what the script does.
Admiral SDTM → ADSL
SDTM DM to ADSL derivation pipeline using admiral blocks: each block is one derivation step with visible intermediate results.
First install blockr as described on the Install page. Then add the extra packages:
pak::pak("BristolMyersSquibb/blockr.admiral")   # admiral derivation blocks (derive_vars_*, merge, seq)
install.packages("pharmaversesdtm")             # SDTM example domains (dm, ex)
Launch the demo:
source(system.file("examples/sdtm-to-adsl.R", package = "blockr.admiral"))Open inst/examples/sdtm-to-adsl.R on GitHub to see exactly what the script does.
Life UWR Workbench
Life-insurance underwriting workbench: a per-coverage expected-claims pipeline plus a UWR price-driver dashboard over a census, claims history, and bundled actuarial tables.
First install blockr as described on the Install page. Then add the extra packages:
pak::pak("cynkra/blockr.input")              # editable data grid (the UWR uw_factors worksheet)
pak::pak("BristolMyersSquibb/blockr.code")   # show / export the generated R code
pak::pak("cynkra/blockr.insurance")          # census + claims data, formula chain, this example
Launch the demo:
source(system.file("examples/life-underwriting.R", package = "blockr.insurance"))Open inst/examples/life-underwriting.R on GitHub to see exactly what the script does.
Actuarial Workbench
Property-insurance actuarial workbench: Base vs Challenger portfolio simulations with editable base-rate grids, premium components, and a run-vs-run compare waterfall.
First install blockr as described on the Install page. Then add the extra packages:
pak::pak("cynkra/blockr.input")              # editable base_rate parameter grids (Base / Challenger)
pak::pak("BristolMyersSquibb/blockr.code")   # show / export the generated R code
pak::pak("cynkra/blockr.insurance")          # pricing engines + portfolio data, this example
Launch the demo:
source(system.file("examples/property-workbench.R", package = "blockr.insurance"))Open inst/examples/property-workbench.R on GitHub to see exactly what the script does.
Treaty Pricer
Layered excess-of-loss treaty pricer: an editable treaty tower drives a piecewise-Pareto severity fit, loss simulation, and a per-layer premium build-up. Edit a layer and the KPIs, quote chart, and build-up waterfall all recompute.
First install blockr as described on the Install page. Then add the extra packages:
pak::pak("cynkra/blockr.input")              # the one editable treaty_tower grid (client structure)
pak::pak("BristolMyersSquibb/blockr.code")   # show / export the generated R code
pak::pak("cynkra/blockr.insurance")          # the treaty tower data + this example
install.packages("Pareto")                   # piecewise-Pareto severity fit + loss simulation
Launch the demo:
source(system.file("examples/treaty-pricer.R", package = "blockr.insurance"))This loads the treaty tower bundled in blockr.insurance and the same blocks as the live demo: the editable tower, Pareto fit and loss simulation, the per-layer quote chart and premium build-up waterfall, the layer-detail drilldown, and a challenger-vs-base comparison. Open inst/examples/treaty-pricer.R on GitHub to see exactly what the script does.
Does mosquito control work?
Refits a published mosquito-control study. The Poisson glm is built in the board by dragging a term in. The paper's negative binomial mixed model is written as plain R. Both reproduce the numbers in the paper. Joint work with Matteo Tanadini, a co-author of the study.
First install blockr as described on the Install page. Then add the extra packages:
pak::pak("cynkra/blockr.stats")     # dataset + model + model-summary + broom blocks
pak::pak("cynkra/blockr.outline")   # the report builder, the deck builder, the minidag
install.packages("glmmTMB")         # the published arm's fit
install.packages("broom.mixed")     # its tidy() method
install.packages("ggplot2")         # the season figure
install.packages("gtsummary")       # every table on the board
install.packages("broom.helpers")   # gtsummary's tidier bridge, a Suggests since gtsummary 2.x
Launch the demo:
source(system.file("examples/aedes-ivm.R", package = "blockr.stats"))Nothing is preloaded. The read block fetches Additional file 2 from the publisher on startup, so the board needs a working internet connection, and every number on it is computed from that file. The published arm fits a negative binomial mixed model at startup, which takes a few seconds before the Model view settles. Render the report from the Report view: what downloads is a Quarto document whose chunks are ordinary R, with no blockr call in it, so it renders in any session that has the packages above. Open inst/examples/aedes-ivm.R on GitHub to see exactly what the script does.
Is the economy growing, or is it just the season?
Swiss quarterly GDP is published twice: as it happened, and seasonally adjusted. This board makes the second one. It runs X-13ARIMA-SEATS on SECO's unadjusted series with no settings and puts the result beside SECO's own published adjustment: over 186 quarters they agree to a median of 0.12 percent. Data from dataseries.org.
First install blockr as described on the Install page. Then add the extra packages:
pak::pak("cynkra/blockr.ts")         # pick, transform, combine
pak::pak("cynkra/blockr.seasonal")   # the X-13 block and the series extractor
pak::pak("cynkra/blockr.outline")    # the outline and the report builder
Launch the demo:
source(system.file("examples/ch-gdp-season.R", package = "blockr.seasonal"))Nothing is preloaded. The read block fetches the series from the dataseries.org API on startup, so the board needs a working internet connection, and every number on it is computed from that file. X-13 fits at startup, which takes a second or two before the Adjustment view settles. Render the report from the Report view: what downloads is a Quarto document that fetches its own data and renders outside the board. Two of its chunks call blockr.seasonal and blockr.ts, so those two have to be installed; no board, no board file and no other blockr package. Open inst/examples/ch-gdp-season.R on GitHub to see exactly what the script does.
Cat Breeds
A full cat-breeds analysis end to end: trait radar, headline KPIs, correlations, a temperament word cloud and a chart-filter to drilldown pair, with AI wired both per-block and board-level (the useR! 2026 demo).
First install blockr as described on the Install page. Then add the extra packages:
pak::pak("cynkra/blockr.leaflet")     # custom "map block" we built (markers per origin)
pak::pak("cynkra/blockr.catbreeds")   # this package: catbreeds data block + card/flags/stats/similar
Launch the demo:
source(system.file("examples/app.R", package = "blockr.catbreeds"))Open inst/examples/app.R on GitHub to see exactly what the script does.
DuckDB Lazy (100M rows)
A 100,000,000-row parquet opened as a lazy DuckDB table and transformed through a chain of blockr.dplyr blocks. Every verb pushes to SQL and the preview pages through 100M rows without ever materializing the full table; only the filtered ~1000-row result is collected into R.
First install blockr as described on the Install page. Then add the extra packages:
install.packages("duckdb")   # embedded OLAP engine, reads parquet
install.packages("DBI")      # database connection layer
install.packages("dbplyr")   # translates dplyr verbs to SQL
Launch the demo:
source(system.file("examples/duckdb-lazy.R", package = "blockr.dplyr"))The 100M-row parquet is generated once into a local cache on first run (override with n_rows <- 5e6 before sourcing for a lighter run). On blockr.cloud it is pre-generated on the host and mounted read-only at /data instead. Open inst/examples/duckdb-lazy.R on GitHub to see exactly what the script does.
DuckDB Remote dm (5M-row star schema)
A 5,000,000-row DuckDB star schema (one fact table, three dimensions) bound into a dm and explored with the Key-lines preview - the fact table pages in the database and is never collected. A second in-memory example dm renders through the same preview.
First install blockr as described on the Install page. Then add the extra packages:
install.packages("duckdb")   # embedded OLAP engine, reads parquet
install.packages("DBI")      # database connection layer
install.packages("dbplyr")   # translates dplyr verbs to SQL
Launch the demo:
source(system.file("examples/duckdb-remote-dm.R", package = "blockr.dm"))The star-schema parquet self-generates into a local cache on first run (override with n_orders <- 5e5L); no external data or host mount needed. Open inst/examples/duckdb-remote-dm.R on GitHub to see exactly what the script does.
Data Collection Process
A quarterly data collection from eight reporting units, run as a process rather than a dashboard. The definition is one wide table; the state is an append-only event log; a headless worker runs the tasks that are scripts. The three front tasks repeat per unit inside a BPMN multi-instance sub-process, the QA check answers true/false on stdout so the branch and its rework loop live in the table, and "Simulate delivery" writes an inbox message the way an upload platform would - the worker turns it into an event.
First install blockr as described on the Install page. Then add the extra packages:
pak::pak("cynkra/blockr.outline")   # the outline rail the process editor is built on
pak::pak("cynkra/blockr.process")
Launch the demo:
source(system.file("examples/data-collection.R", package = "blockr.process"))The board starts with NO instance: opening one is the first move. The store is per container at /tmp/blockr-process-demo, so a second browser window watches the same event log - tick a task in one and it appears in the other. The app starts its own worker as a hosting convenience; the design rule is that the worker lives outside the app (see vignette("running-scripts")), and BLOCKR_PROCESS_WORKER=0 turns it off so you can run one in a terminal and watch it work. Open inst/examples/data-collection.R on GitHub to see exactly what the script does.
Portfolio Advisor
A portfolio advisor: pick an investor risk profile and an optimizer strategy on the left, and a diversified allocation dashboard recomputes on the right. A second Workflow tab shows the live block graph.
First install blockr as described on the Install page. Then add the extra packages:
pak::pak("cynkra/blockr.portfolio")Launch the demo:
source(system.file("examples/app-portfolio.R", package = "blockr.portfolio"))This loads the bundled asset universe and the same blocks as the live demo: the investor profile, the mean-variance optimizer, and the allocation dashboard. Edit the risk profile or strategy and the dashboard recomputes. Open inst/examples/app-portfolio.R on GitHub to see exactly what the script does.
Share Explorer
An interactive share explorer: choose tickers and a date range on the left and the price / return charts recompute on the right. A second Workflow tab shows the live block graph.
First install blockr as described on the Install page. Then add the extra packages:
pak::pak("cynkra/blockr.portfolio")Launch the demo:
source(system.file("examples/app-explorer.R", package = "blockr.portfolio"))Ticker data is fetched via quantmod (AAPL / MSFT / GOOG / AMZN by default), with a bundled offline fallback. Change the ticker or date selection and the explorer recomputes. Open inst/examples/app-explorer.R on GitHub to see exactly what the script does.