
Work with many tables
Data often comes as several linked tables. This tutorial loads a data model, four tables with key relationships, flattens it into one analysis table, and charts it.
Watch the flow, then follow the steps below:
Do it yourself
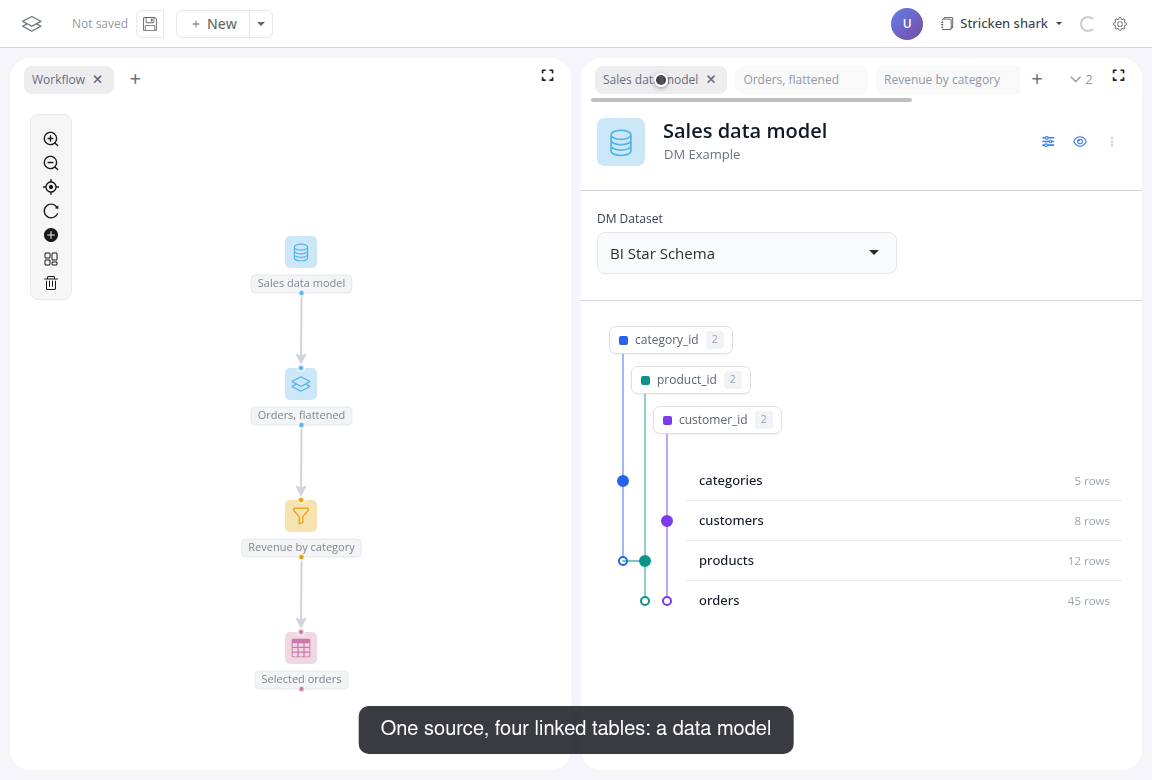
Add a "DM Example" block and pick "BI Star Schema". Its preview draws the model: categories, products, customers and orders, with the key relationships as lines:
Add a "Flatten dm" block after it. Start from "orders" and leave "Recursive" on: the output is one flat table, every order joined with its product, category and customer columns along the keys.
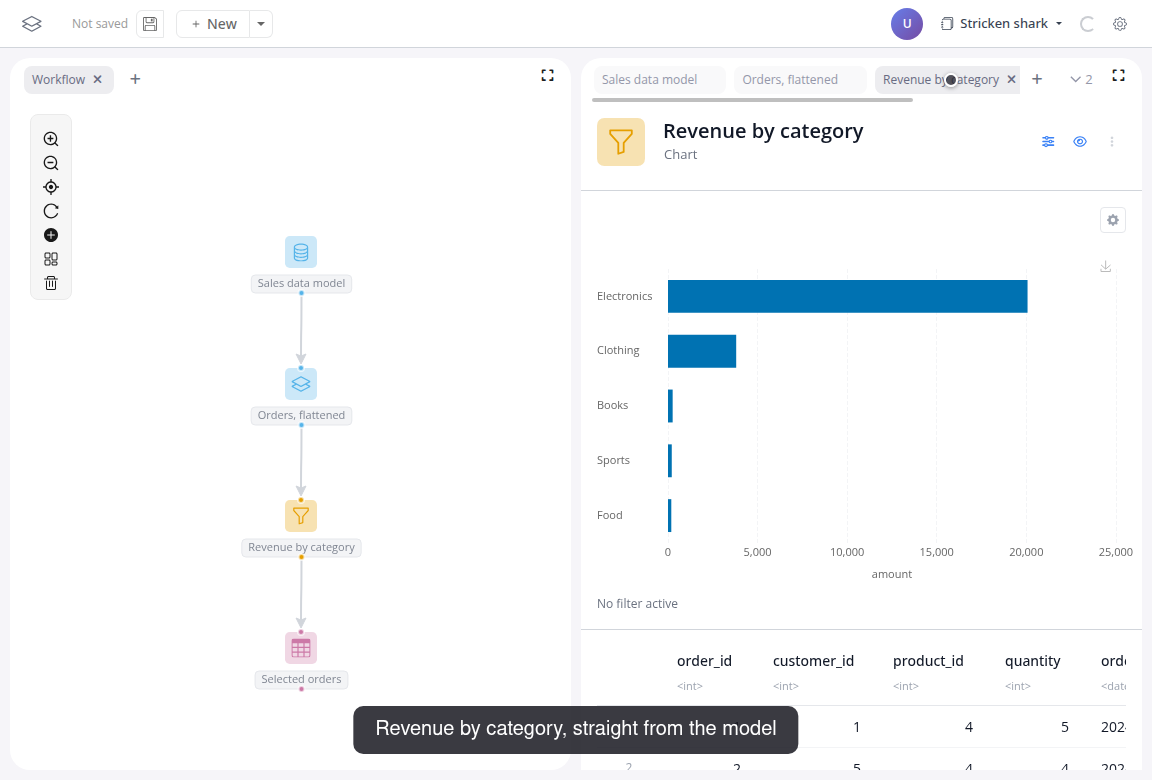
Add a "Chart" block after that: group by "category_name", value "amount", function "sum", drill on "category_name".
Add a "Table" block after the chart. Click a bar in the chart: the table shows the orders behind it, like in the previous tutorial.
For your own relational data, the other dm blocks read models from files or a database connection; the blockr.dm reference lists them. And the same blocks run on lazy database tables: the DuckDB demo pages through 100 million rows without ever materializing them.