
For Analysts
Explore and transform data visually, no coding needed. Point, click, and see results instantly.
Build your first app
Drag analysis steps into interactive dashboards
Each block adds a step of R code to the board. The Report tab gives you the whole script: run it without blockr, review it, or hand it to someone who codes.
penguins <- datasets::penguins

filtered <- dplyr::filter(
  penguins,
  species %in% c("Adelie", "Gentoo") # @!chin
  species %in% c("Adelie", "Gentoo", "Chinstrap") # @chin
)

ggplot2::ggplot(
  filtered,
  ggplot2::aes(
    x = bill_len,
    y = bill_dep,
    colour = species # @!island
    colour = island # @island
  )
) +
  ggplot2::geom_point()
Custom code in a board · Create a block
Open a demo board on blockr.cloud, no install needed.
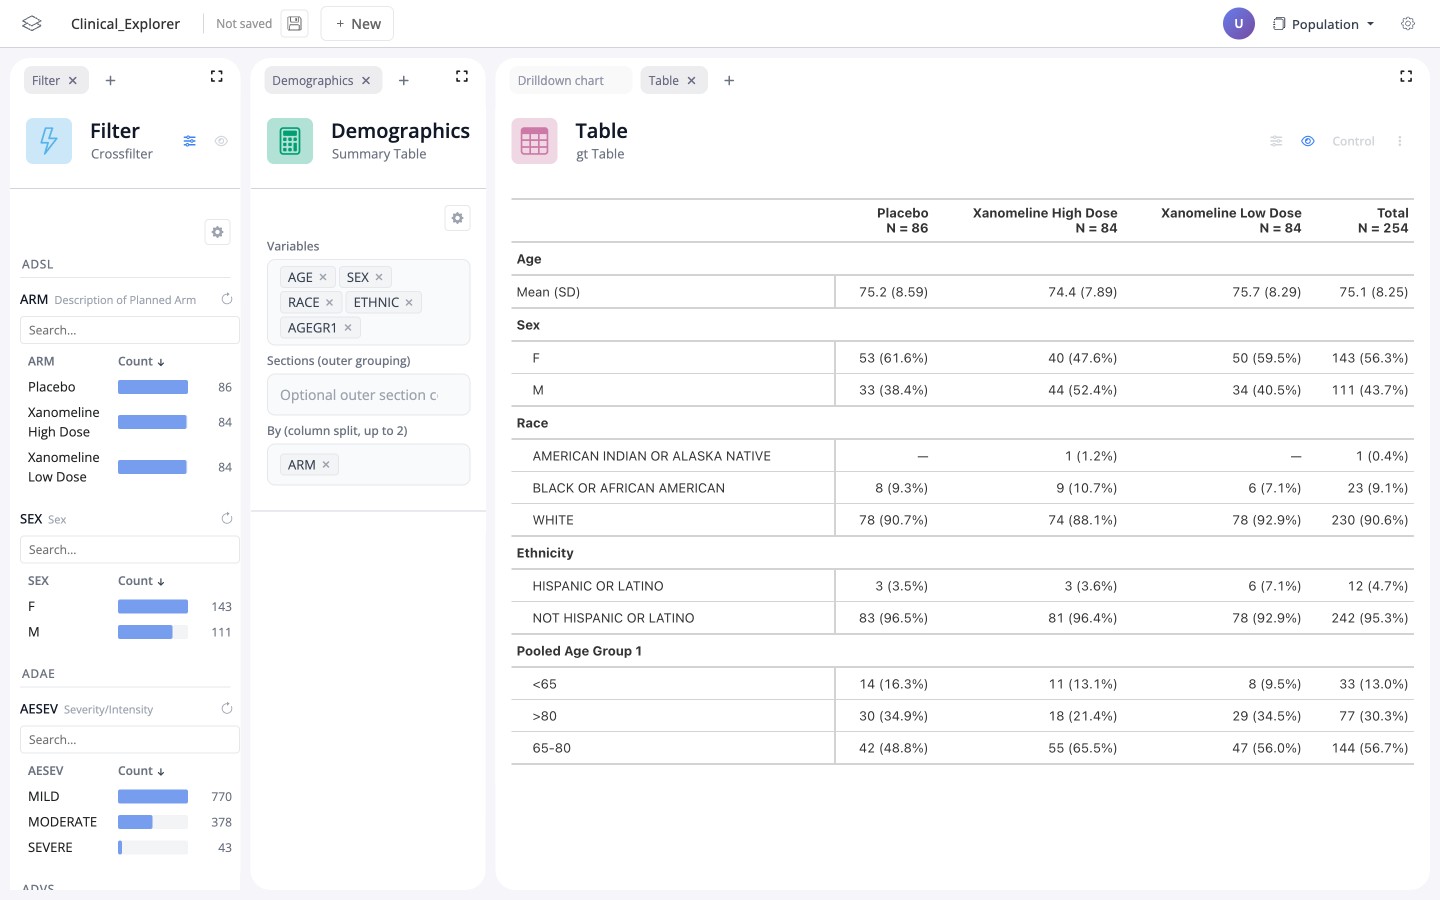
Clinical Explorer
AI-enabled exploration of an ADaM trial: demographics, AE, lab, vitals, patient profile.
Open in Playground →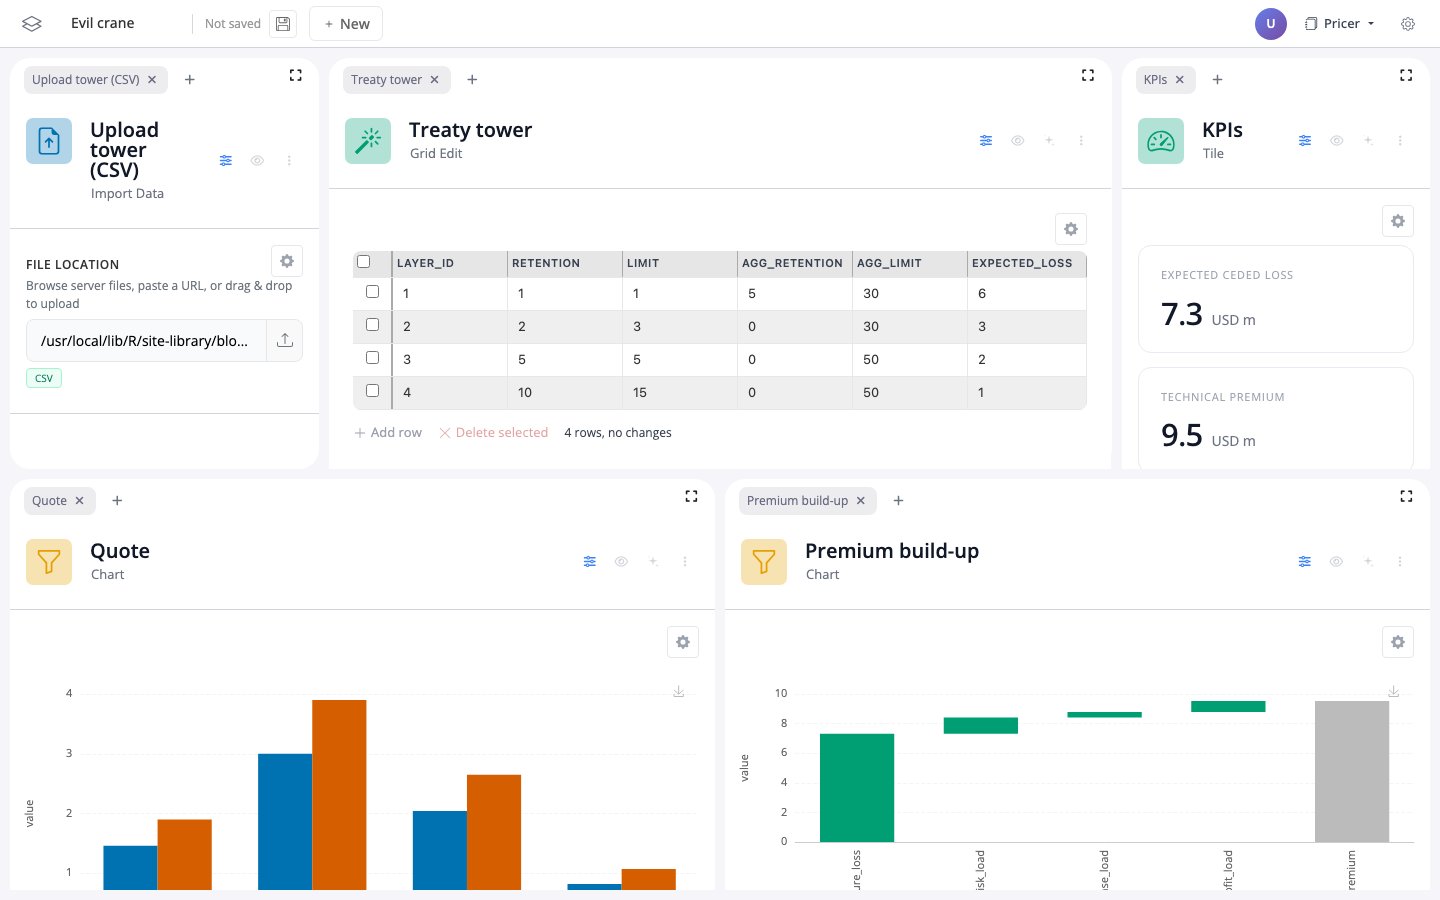
Treaty Pricer
Reinsurance pricing: an editable treaty tower drives the loss simulation and premium.
Open in Playground →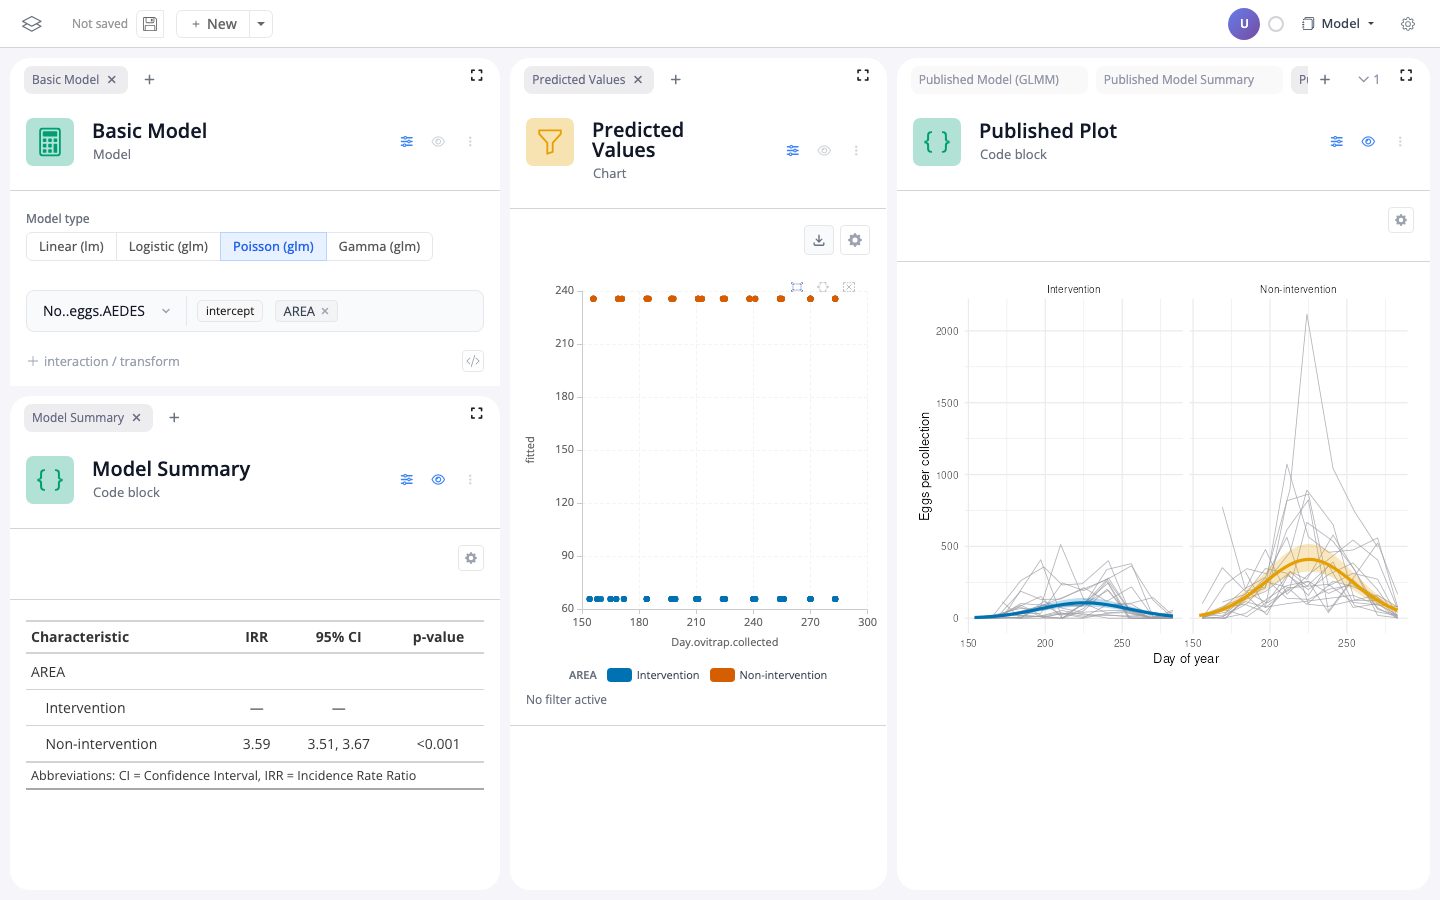
Does mosquito control work?
Refits a published mosquito-control study. The Quarto report comes out of the same board.
Open in Playground →# install.packages("pak")
pak::pak("BristolMyersSquibb/blockr@dev")
blockr::run_app()R 4.1 or later. Details, smaller installs and the AI features: Install.